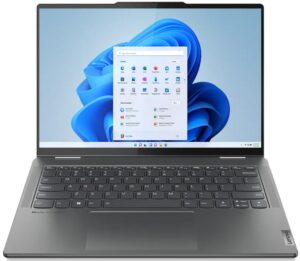
Lenovo Yoga 7i (14″, 2023) review – capable and stable convertible
Temperatures and comfort, Battery Life
Max CPU load
In this test we use 100% on the CPU cores, monitoring their frequencies and chip temperature. The first column shows a computer’s reaction to a short load (2-10 seconds), the second column simulates a serious task (between 15 and 30 seconds), and the third column is a good indicator of how good the laptop is for long loads such as video rendering.
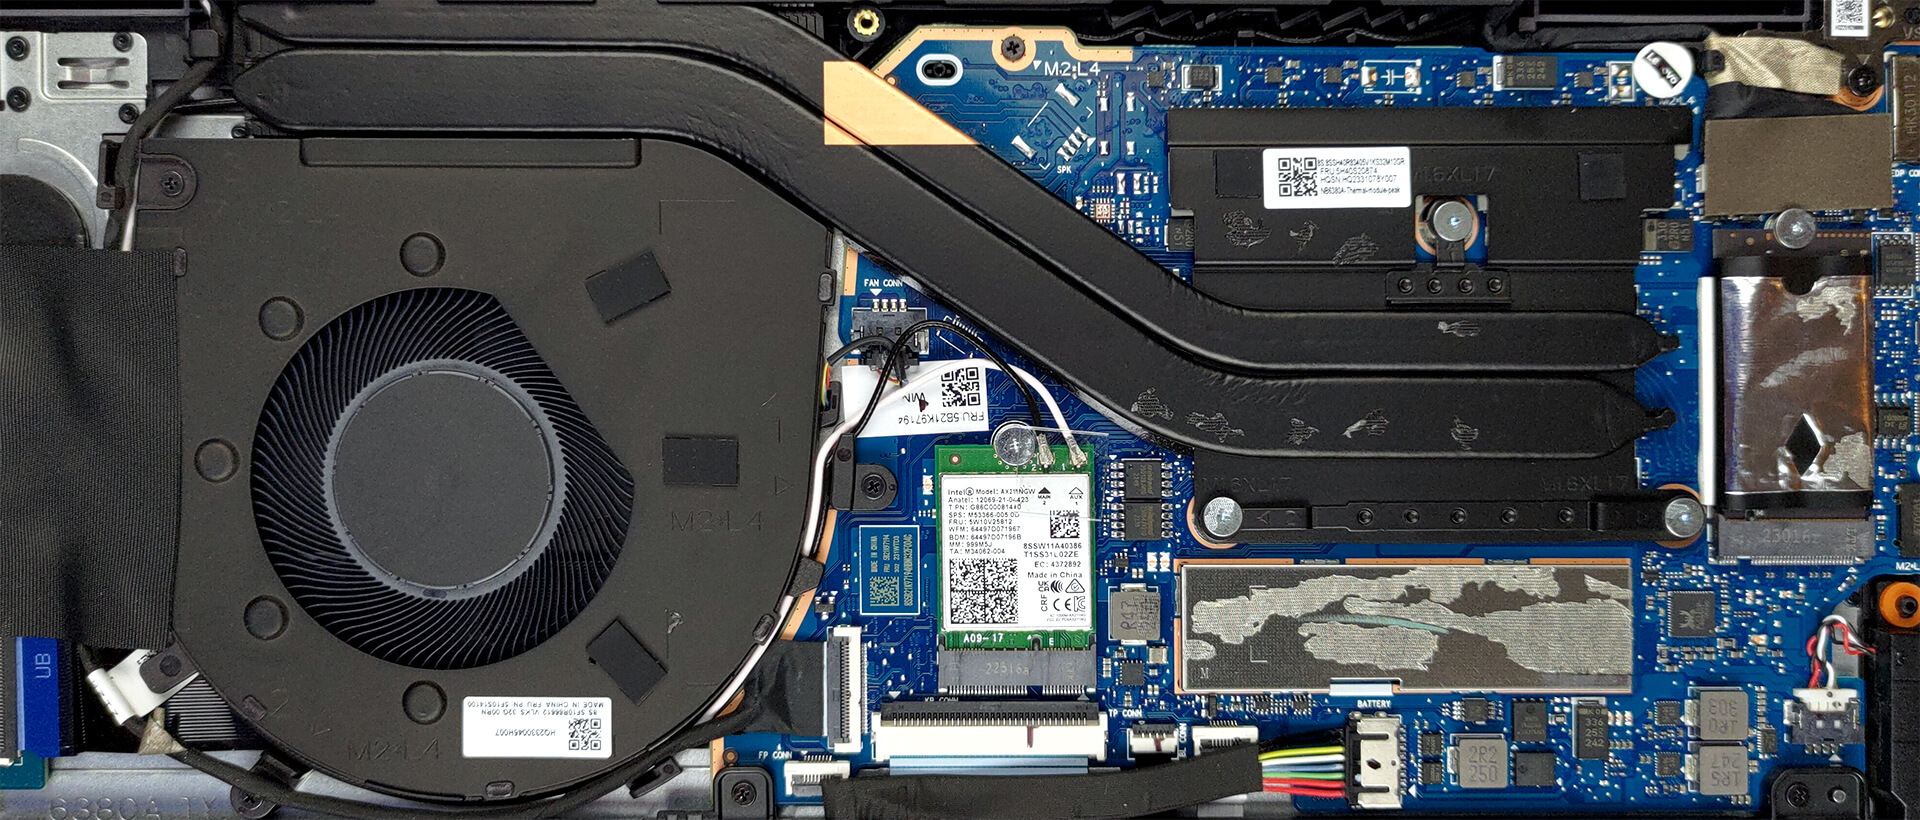
Average P-core frequency; Average E-core frequency; CPU temp.; Package Power
| Intel Core i7-1360P (28W TDP) | 0:02 – 0:10 sec | 0:15 – 0:30 sec | 10:00 – 15:00 min |
|---|---|---|---|
| Lenovo Yoga 7i (14″, 2023) | 3.74 GHz @ 2.72 GHz @ 87°C @ 62W | 2.87 GHz @ 2.19 GHz @ 91°C @ 43W | 1.92 GHz @ 1.31 GHz @ 66°C @ 22W |
| Lenovo Yoga 9 (14″, 2023) | 3.45 GHz @ 2.71 GHz @ 81°C @ 64W | 3.00 GHz @ 2.37 GHz @ 92°C @ 50W | 2.17 GHz @ 1.68 GHz @ 72°C @ 28W |
The Yoga 7i (14″, 2023) performs better than the Yoga 9 in short loads, but the tables turn when we reach medium and long loads. The temperature profile is very similar, but the Yoga 7i runs at a 6W lower power limit at the end of the test.
Comfort during full load
On the bright side, the laptop remains pretty quiet during the entire test. Plus, its keyboard doesn’t get too hot either.

Battery
Now, we conduct the battery tests with the Windows Better performance setting turned on, screen brightness adjusted to 120 nits and all other programs turned off except for the one we are testing the notebook with.
Φωτεινότητα: 180 nits; Λειτουργία οθόνης: SDR
Χρόνος μέχρι την πλήρη εκφόρτιση: Υψηλότερο είναι καλύτερο

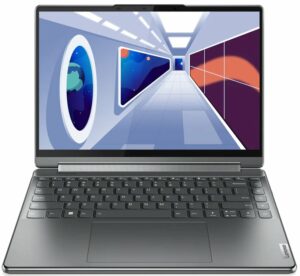
Για την προσομοίωση πραγματικών συνθηκών, χρησιμοποιήσαμε το δικό μας σενάριο για αυτόματη περιήγηση στο διαδίκτυο σε πάνω από 70 ιστότοπους.
 Author: Alex Iliev
 Author: eng. Kroum NikolovHead of Engineering at LaptopMedia.com, inventor and innovator with 40+ years of experience in electronics and high technology.

![[Αύγουστος 2026] Παγκόσμια κατάταξη των πιο δημοφιλών GPU για φορητούς υπολογιστές στο Amazon – Η Apple κυριαρχεί, ενώ η RTX 5060 της NVIDIA βρίσκεται στην κορυφή της κατάταξης των ειδικών καρτών](https://laptopmedia.com/wp-content/uploads/2026/09/Best-Selling-GPUs-GLOBAL-Top-10-400x225.jpg)
![[Αύγουστος 2026] Παγκόσμια κατάταξη των πιο δημοφιλών επεξεργαστών φορητών υπολογιστών στο Amazon – Η Apple κυριαρχεί τόσο στην κατηγορία των οικονομικών όσο και στην κατηγορία των premium μοντέλων: Οι A18 Pro και M5 συντρίβουν την Intel και την AMD τον Αύγουστο του 2026](https://laptopmedia.com/wp-content/uploads/2026/09/Best-Selling-CPUs-GLOBAL-Top-10-400x225.jpg)
![[Αύγουστος 2026] Amazon Global: Οι 10 φορητοί υπολογιστές με τις μεγαλύτερες πωλήσεις – Το Apple MacBook Neo κυριαρχεί στις λίστες, ενώ οι οικονομικοί και μεσαίας κατηγορίας φορητοί υπολογιστές με Windows ανταγωνίζονται για τον όγκο πωλήσεων](https://laptopmedia.com/wp-content/uploads/2026/09/Best-Selling-Laptops-GLOBAL-Top-10-400x225.jpg)
![[Αύγουστος 2026] Οι μάρκες φορητών υπολογιστών με τις μεγαλύτερες πωλήσεις στο Amazon Global – Η Apple κυριαρχεί σε έσοδα, ενώ η HP πρωτοστατεί στην ποικιλία μοντέλων](https://laptopmedia.com/wp-content/uploads/2026/09/GLOBAL-Best-Brands-400x225.jpg)
![[Αύγουστος 2026] Amazon Global: Οι 10 πιο δημοφιλείς φορητοί υπολογιστές για παιχνίδια – Ο HP Victus 15 κατακτά την πρώτη θέση, ενώ τα οικονομικά μοντέλα κυριαρχούν στις λίστες](https://laptopmedia.com/wp-content/uploads/2026/09/Best-Selling-Gaming-Laptops-GLOBAL-Top-10-400x225.jpg)