Apple M5 vs M4、M3、M2、M1 (+Pro/Max/Ultra):完全比較!
アップルは、MシリーズCPUをレゴのように機能するよう巧妙に設計しており、ペアリングしてより強力なチップを作ることができる。例えば、M-Ultraチップは基本的に2つのM-Max CPUを組み合わせたもので、インテルとAMDのあらゆるCPUに挑戦するために、リソースを効果的に倍増させる。しかし、今日の焦点はチーム・ブルーとチーム・レッドではなく、4世代すべてのMシリーズ・プロセッサーを比較することです。
さらに、Apple M5 Pro、M5 Max、M5 Ultra、そしてもちろんM4 Ultraの予想スコアも掲載します。さあ、始めよう!
[01/2025] 更新Apple M4(8コアCPU)、M4(10コアCPU)、M4 Pro(12コアCPU)、M4 Pro(14コアCPU)、M4 Max(14コアCPU)、M4 Max(16コアCPU)を追加しました。
[03/2025] 更新Apple M3 Ultraを追加しました。
[11/2025] 更新Apple M5 (9コアおよび10コア)を追加しました。
[03/2026] 更新A18 Pro、Apple M5 Pro(15コアおよび18コア)、Apple M5 Maxを追加
アップルCPUラインナップ – 全リスト
Appleは毎年、よりパワフルで効率的なアーキテクチャを発表しており、新世代のApple製チップはいずれも大幅なアップグレードをもたらします:
| アップルSoC | スーパー/パフォーマンス/効率 コア | GPUコア | メモリ 帯域幅 | トランジスタ |
| Apple M5 Max(18コアCPU、40c GPU) | 6S+12P | 40 | 614 GB/s | – |
| Apple M5 Max(18コアCPU、32c GPU) | 6S+12P | 32 | 460 GB/s | – |
| Apple M5 Pro(18コアCPU) | 6S+12P | 20 | 307 GB/s | – |
| Apple M5 Pro(15コアCPU) | 5S+10P | 16 | 307 GB/s | – |
| アップルM5(10コアCPU) | 4P+6E | 10 | 153 GB/s | – |
| アップルA18プロ(MacBook Neo) | 2P+4E | 5 | 60 GB/s | – |
| Apple M5 (9コアCPU) | 3P+6E | 10 | 153 GB/s | – |
| Apple M4 Max(16コアCPU) | 12P+4E | 40 | 546 GB/s | – |
| Apple M4 Max(14コアCPU) | 10P+4E | 32 | 410 GB/s | – |
| Apple M4 Pro(14コアCPU) | 10P+4E | 20 | 273 GB/s | – |
| Apple M4 Pro(12コアCPU) | 8P+4E | 16 | 273 GB/s | – |
| Apple M4 (10コアCPU) | 4P+6E | 10 | 120 GB/s | 280億 |
| アップルM4(9コアCPU) | 3P+6E | 8 | 120 GB/s | 280億ドル |
| Apple M4(8コアCPU) | 4P+4E | 8 | 120 GB/s | 280億ドル |
| Apple M3 Ultra(32コアCPU) | 24P+8E | 80 | 819.3 GB/s | 1,840億ドル |
| Apple M3 Ultra(28コアCPU) | 20P+8E | 60 | 819.3 GB/s | 1,840億ドル |
| アップルM3マックス(16コアCPU) | 12P+4E | 30または40 | 408.6 GB/s | 920億 |
| Apple M3 Max(14コアCPU) | 10P+4E | 30または40 | 307.2 GB/s | 920億 |
| Apple M3 Pro(12コアCPU) | 6P+6E | 14または16 | 153.6 GB/s | 370億 |
| Apple M3 Pro(11コアCPU) | 5P+6E | 14または16 | 153.6 GB/s | 370億 |
| アップルM3(8コアCPU) | 4P+4E | 8または10 | 102.4 GB/s | 250億 |
| Apple M2 Ultra(24コアCPU) | 16P+8E | 60または76 | 819.2 GB/s | 1,340億ドル |
| Apple M2 Max(12コアCPU) | 8P+4E | 30または38 | 409.6 GB/s | 670億ドル |
| Apple M2 Pro(12コアCPU) | 6P+4E | 16または19 | 204.8 GB/s | 400億ドル |
| Apple M2 Pro(10コアCPU) | 6P+4E | 16または19 | 204.8 GB/s | 400億ドル |
| Apple M2(8コアCPU) | 4P+4E | 8または10 | 102.4 GB/s | 200億ドル |
| Apple M1 Ultra(20コアCPU) | 16P+4E | 64 | 819.2 GB/s | 1,140億ドル |
| Apple M1 Max(10コアCPU) | 8P+2E | 24または32 | 409.6 GB/s | 570億 |
| Apple M1 Pro(10コアCPU) | 8P+2E | 16 | 204.8 GB/s | 337億 |
| Apple M1 Pro(8コアCPU) | 6P+2E | 14 | 204.8 GB/s | 337億 |
| アップルM1(8コアCPU) | 4P+4E | 7または8 | 68.3 GB/s | 160億 |
アップル M1 vs M2 vs M3 vs M4 vs M5
まず、MシリーズCPUの “ベース “バリアントの進化を検証してみよう。
以下は、これらのベースバリアントのシングルコア性能をまとめたもので、歴代世代における性能スコアと向上率を示している。
シングルコア性能
シングルコア性能は、ゲームやソフトウェアのコンパイルなど、プロセッサーのコア速度に大きく依存するアプリケーションで最適な速度を実現するために極めて重要です。また、オペレーティング・システムやユーティリティ・アプリケーションの全体的な応答性と効率を決定する上でも重要な役割を果たし、マルチコア最適化が利用できない場合でもスムーズなユーザー体験を保証します。
トップノートパソコンCPUランキングで最も高性能なインテルチップ、インテルCore Ultra 9 285HX(3124ポイント)を参考までに追加しておく。アップルM3とほぼ完全に一致している。MacBook Neoに搭載されているアップルA18 Proは、ちょうどM3とM4の間に位置する。
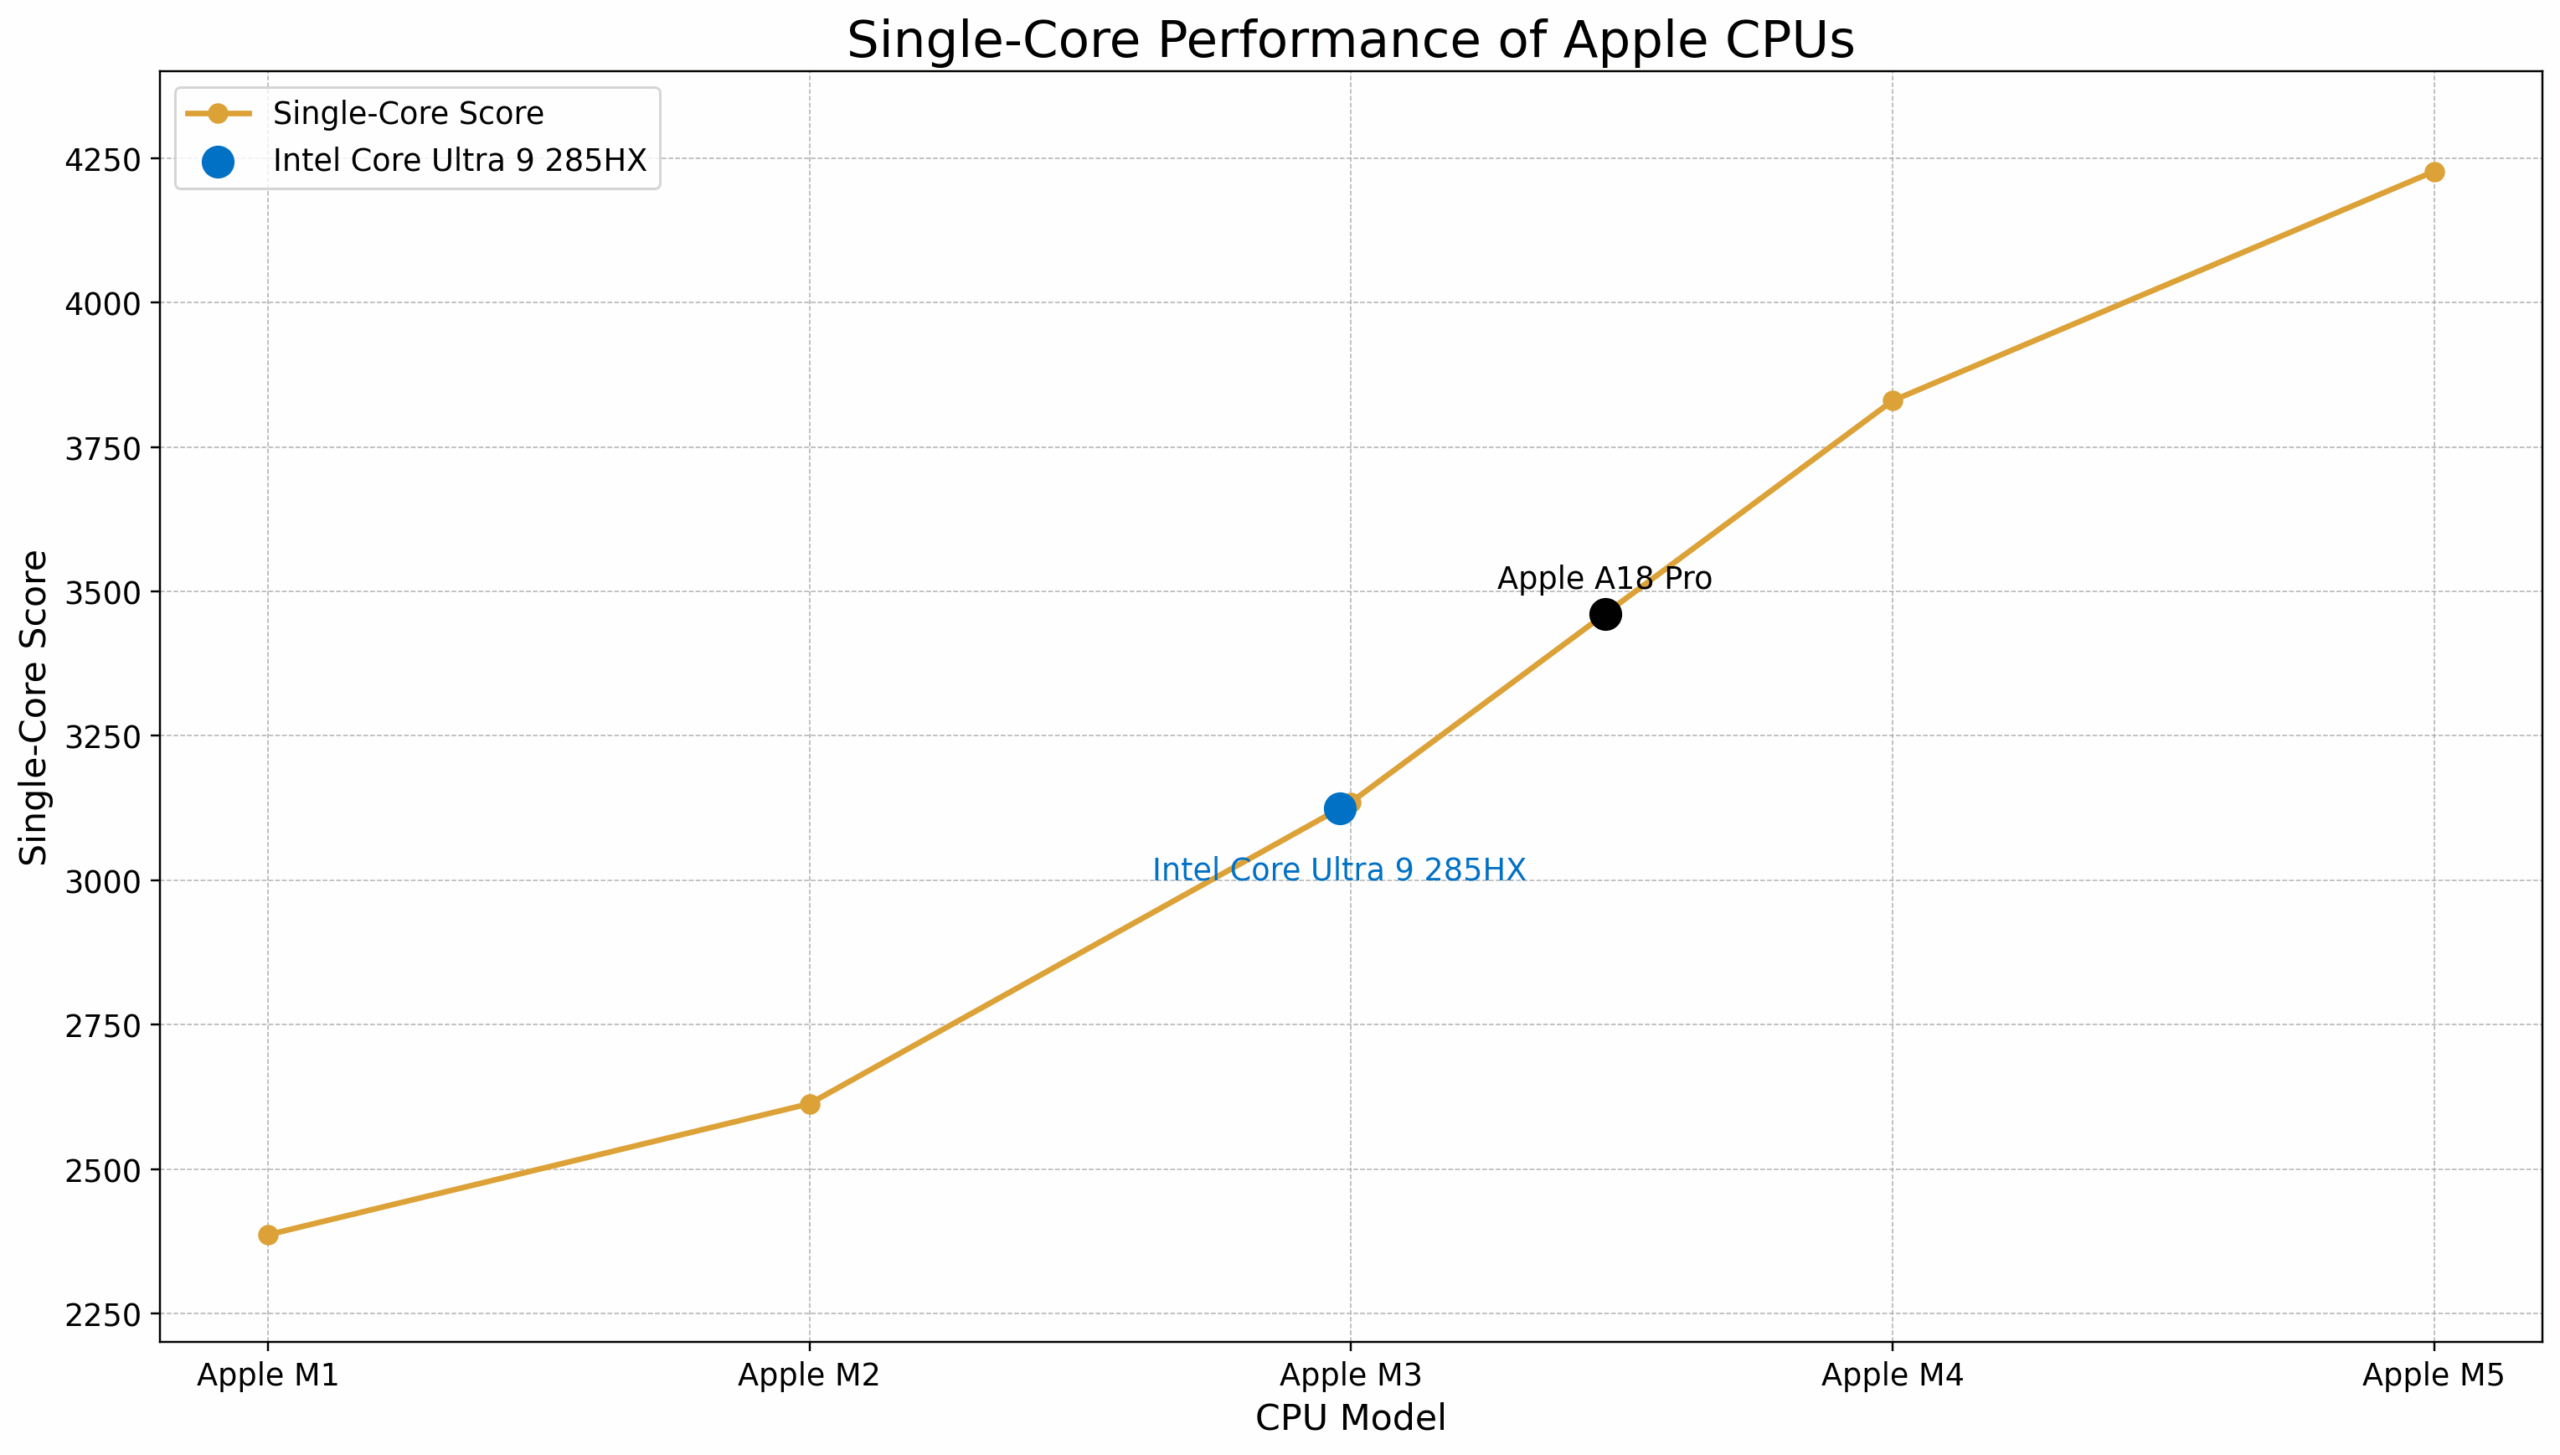
| CPU | ジークベンチ6 シングルコア | パフォーマンスジャンプ(%) |
| アップルM1 | 2386 | – |
| アップルM2 | 2613 | +10% |
| アップル M3 | 3135 | +20% |
| アップル A18 Pro (MacBook Neo) | 3461 | – |
| アップル M4 | 3830 | +22% |
| アップル M5 | 4227 | +10% |
| 平均パフォーマンスジャンプ+16% | ||
Apple M4は、シングルコア性能においてこれまでで最も大きな飛躍を遂げた。
M4には、最も低価格なiMacに搭載される8コアのApple M4と、最も低価格なiPad Proに搭載される9コアのApple M4という、2種類の「切り詰めた」バリエーションもある:
| CPU | Geekbench 6 シングルコア | パフォーマンスジャンプ(%) |
| Apple M4(8コア、iMac) | 3650 | |
| Apple M4(9コア、iPad) | 3671 | +0.5% |
| Apple M4(10コア、MacBook Pro) | 3830 | +4% |
マルチコア性能
マルチコア性能は、ビデオ編集、3Dレンダリング、科学シミュレーションなど、複雑で負荷のかかるタスクを処理するために不可欠です。
下の表は、アップルのベースとなるMシリーズCPUのマルチコア性能の詳細で、世代が新しくなるごとにスコアが向上し、性能が向上していることを強調しています。文脈のために、トップノートパソコンCPUランキングでトップの性能を誇るインテル製チップ、インテルCore Ultra 9 285HXのスコア22215点も加えています。
MacBook NeoのApple A18 Proは、Apple M1チップのすぐ上に位置しています。
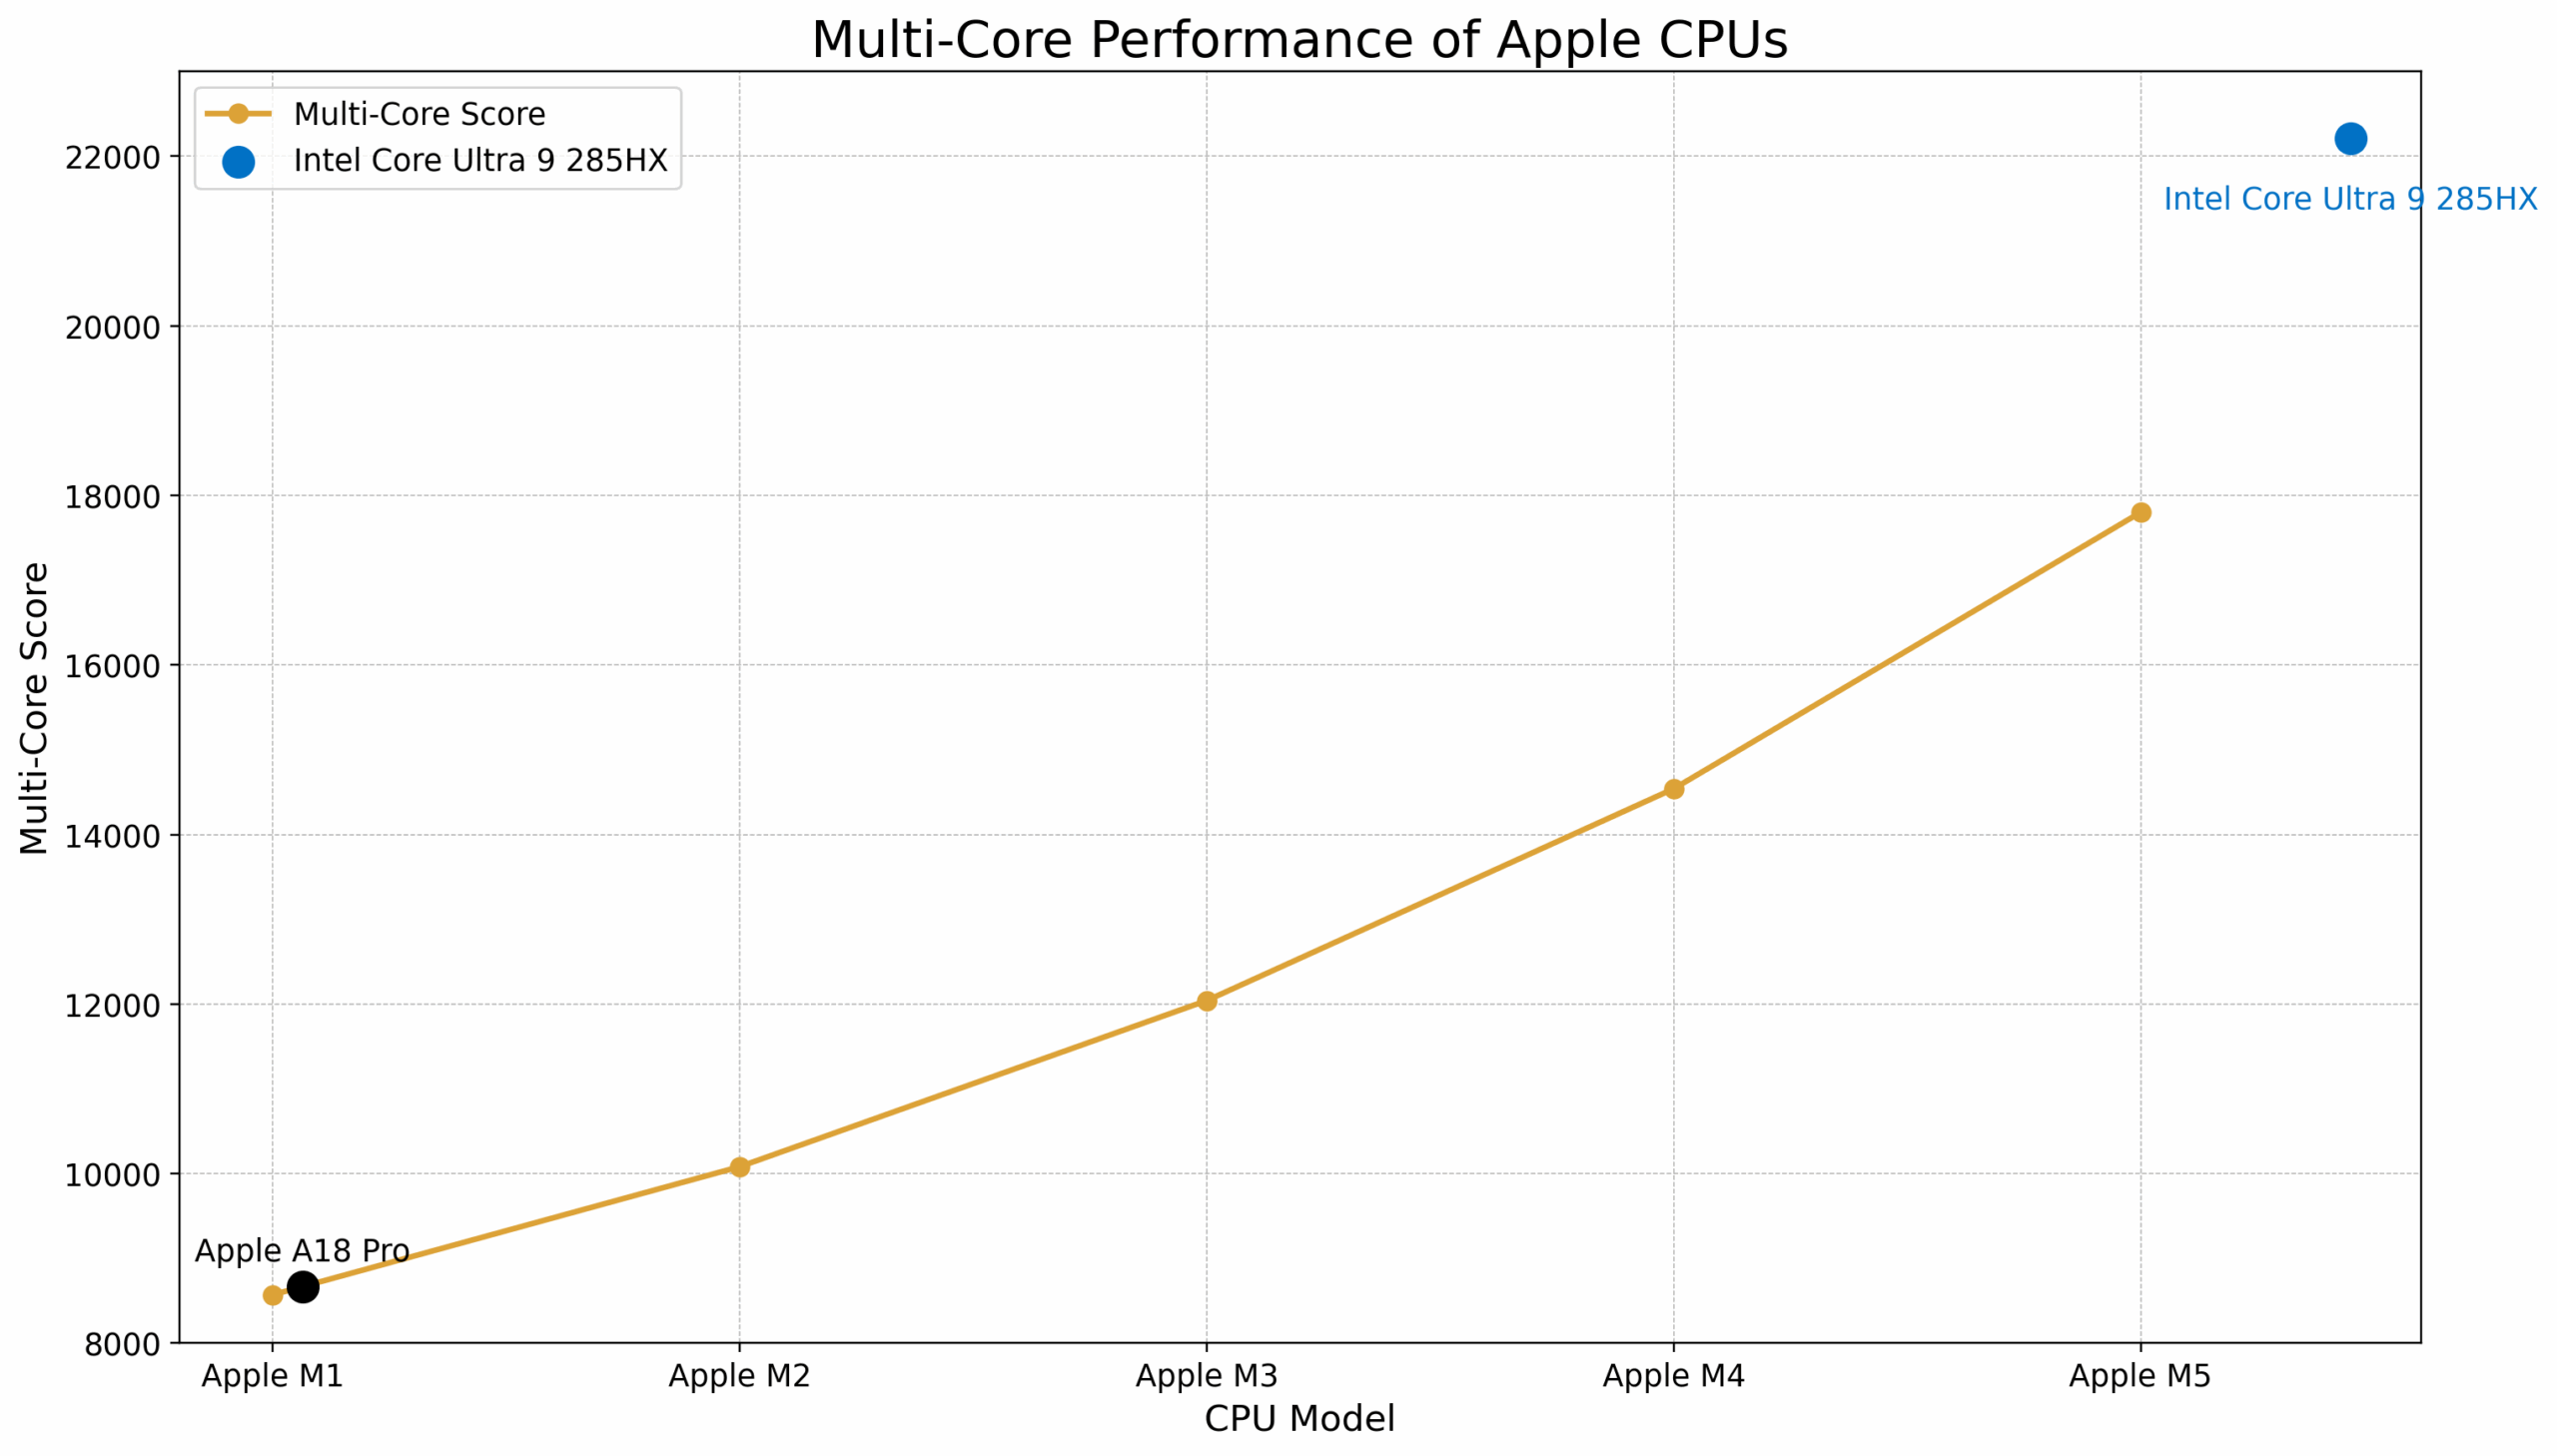
| CPU | ジークベンチ6 マルチコア | パフォーマンスジャンプ(%) |
| アップルM1 | 8571 | – |
| アップル A18 Pro(MacBook Neo) | 8668 | – |
| アップル M2 | 10082 | +18% |
| アップル M3 | 12042 | +19% |
| アップル M4 | 14541 | +21% |
| アップル M5 | 17802 | +22% |
| 平均パフォーマンスジャンプ+20% | ||
マルチコア性能は、シングルコア性能の向上と密接に関連しており、最新のM5が最も大幅な進歩を示している。しかし、複雑なタスクでは、ベースモデルは依然としてインテルのフラッグシップモデルであるCore Ultra 9 285HXの後塵を拝している。
もう一度、M4のバリエーションを比較してみましょう:
| CPU | パフォーマンス コア | Geekbench 6 マルチコア | パフォーマンスジャンプ(%) |
| Apple M4(9コア、iPad) | 3 | 13 381 | |
| Apple M4(8コア、iMac) | 4 | 13 836 | +3% |
| Apple M4(10 コア、MacBook Pro) | 4 | 14 990 | +8% |
では、Apple MシリーズのPro、Max、Ultraのバリエーションと比較してみよう。
Apple M1 Pro vs M2 Pro vs M3 Pro vs M4 Pro vs M5 Pro
14コアのM4 Proは10個のパフォーマンス・コアを搭載し、45%という驚異的なパフォーマンス・ジャンプを実現する!これは、インテルのモバイル・フラッグシップIntel Core Ultra 9 285HXよりも3%高い。つまり、基本的にUltra 9 285HXは、シングルコアではApple M3、マルチコアではApple M4 Proと同程度の速さなのだ。
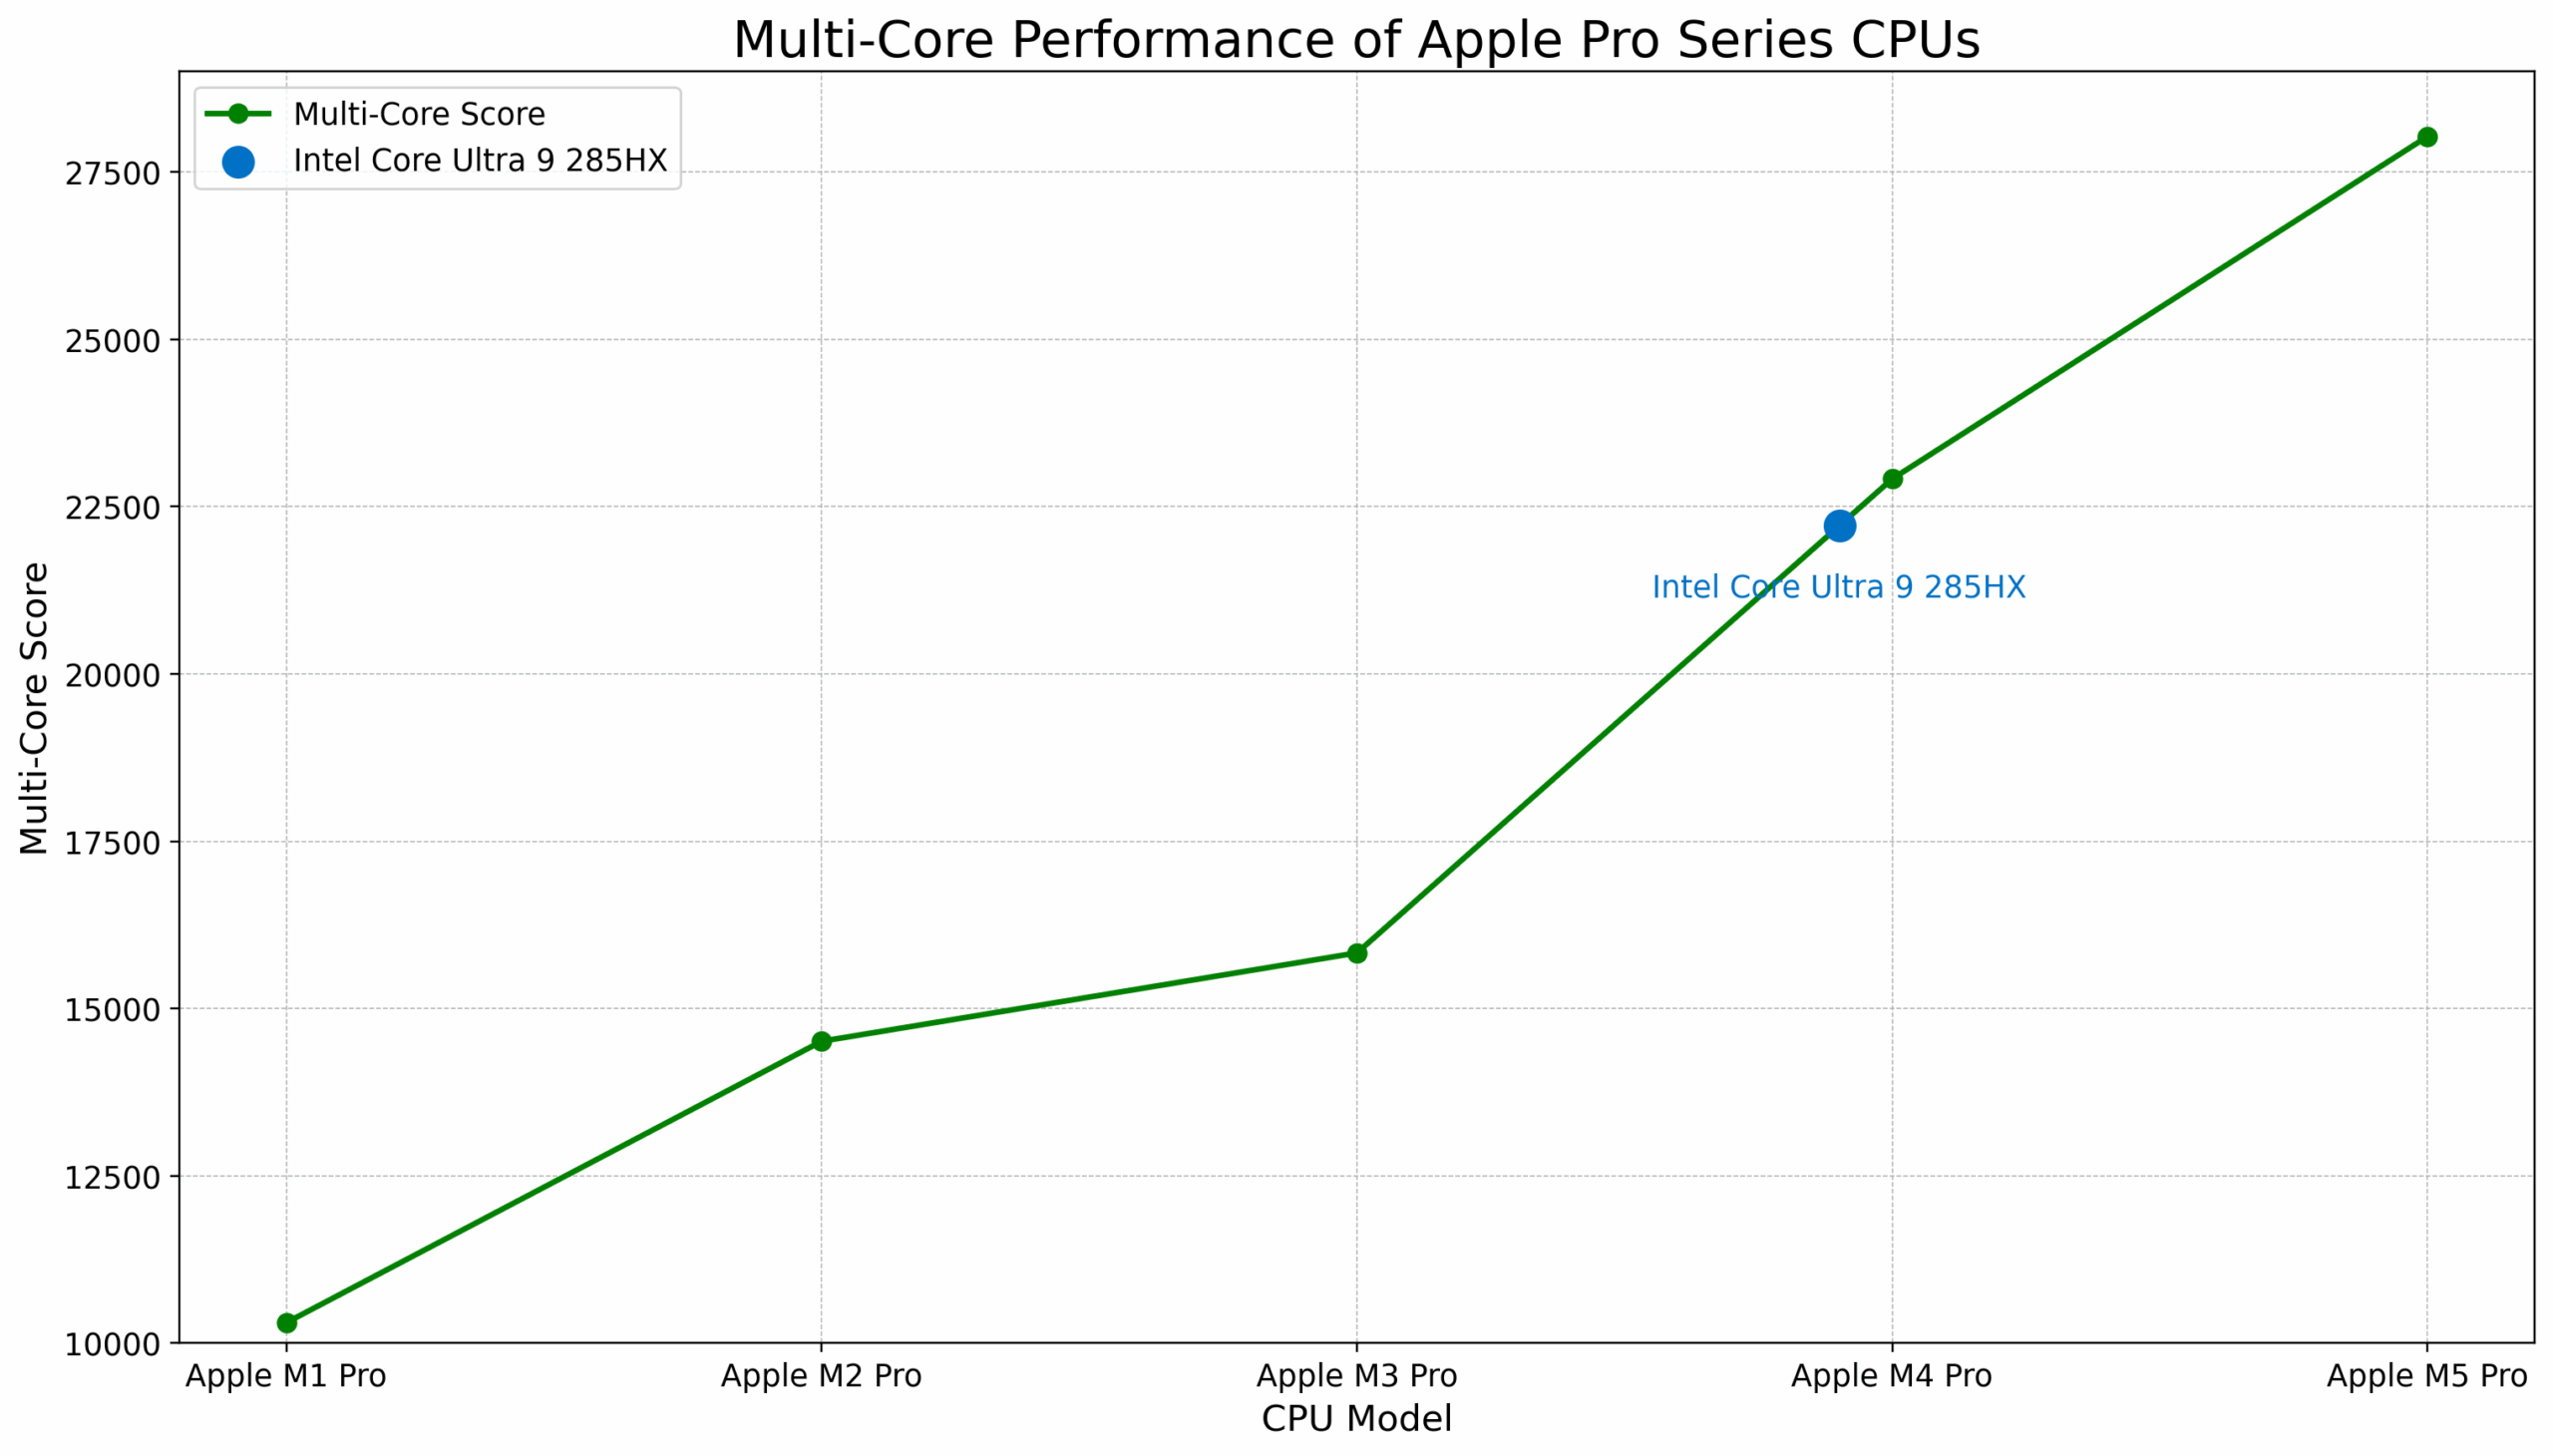
| CPU | ジークベンチ6 マルチコア | パフォーマンスジャンプ(%) |
| Apple M1 Pro(8コアCPU) | 10 307 | |
| Apple M2 Pro(12コアCPU) | 14 511 | +41% |
| Apple M3 Pro(12コアCPU) | 15 831 | +9% |
| Apple M4 Pro (14コアCPU) | 22 914 | +45% |
| Apple M5 Pro(18コアCPU) | 28030 | +22% |
| 平均パフォーマンスジャンプ29% | ||
アップル M1 Max vs M2 Max vs M3 Max vs M4 Max vs M5 Max
M3 Maxは、モバイル・プロセッサーの比較において、インテルの当時のフラッグシップi9-14900HXを上回った唯一のアップル製プロセッサーだった。現在、青いフラッグシップはインテルCore Ultra 9 285HXであり、そのマルチコアの結果はM3 MaxとM4 Maxのちょうど中間に位置している。
M5 Maxのスコアは29 159ポイントで285HXを31%上回っている:
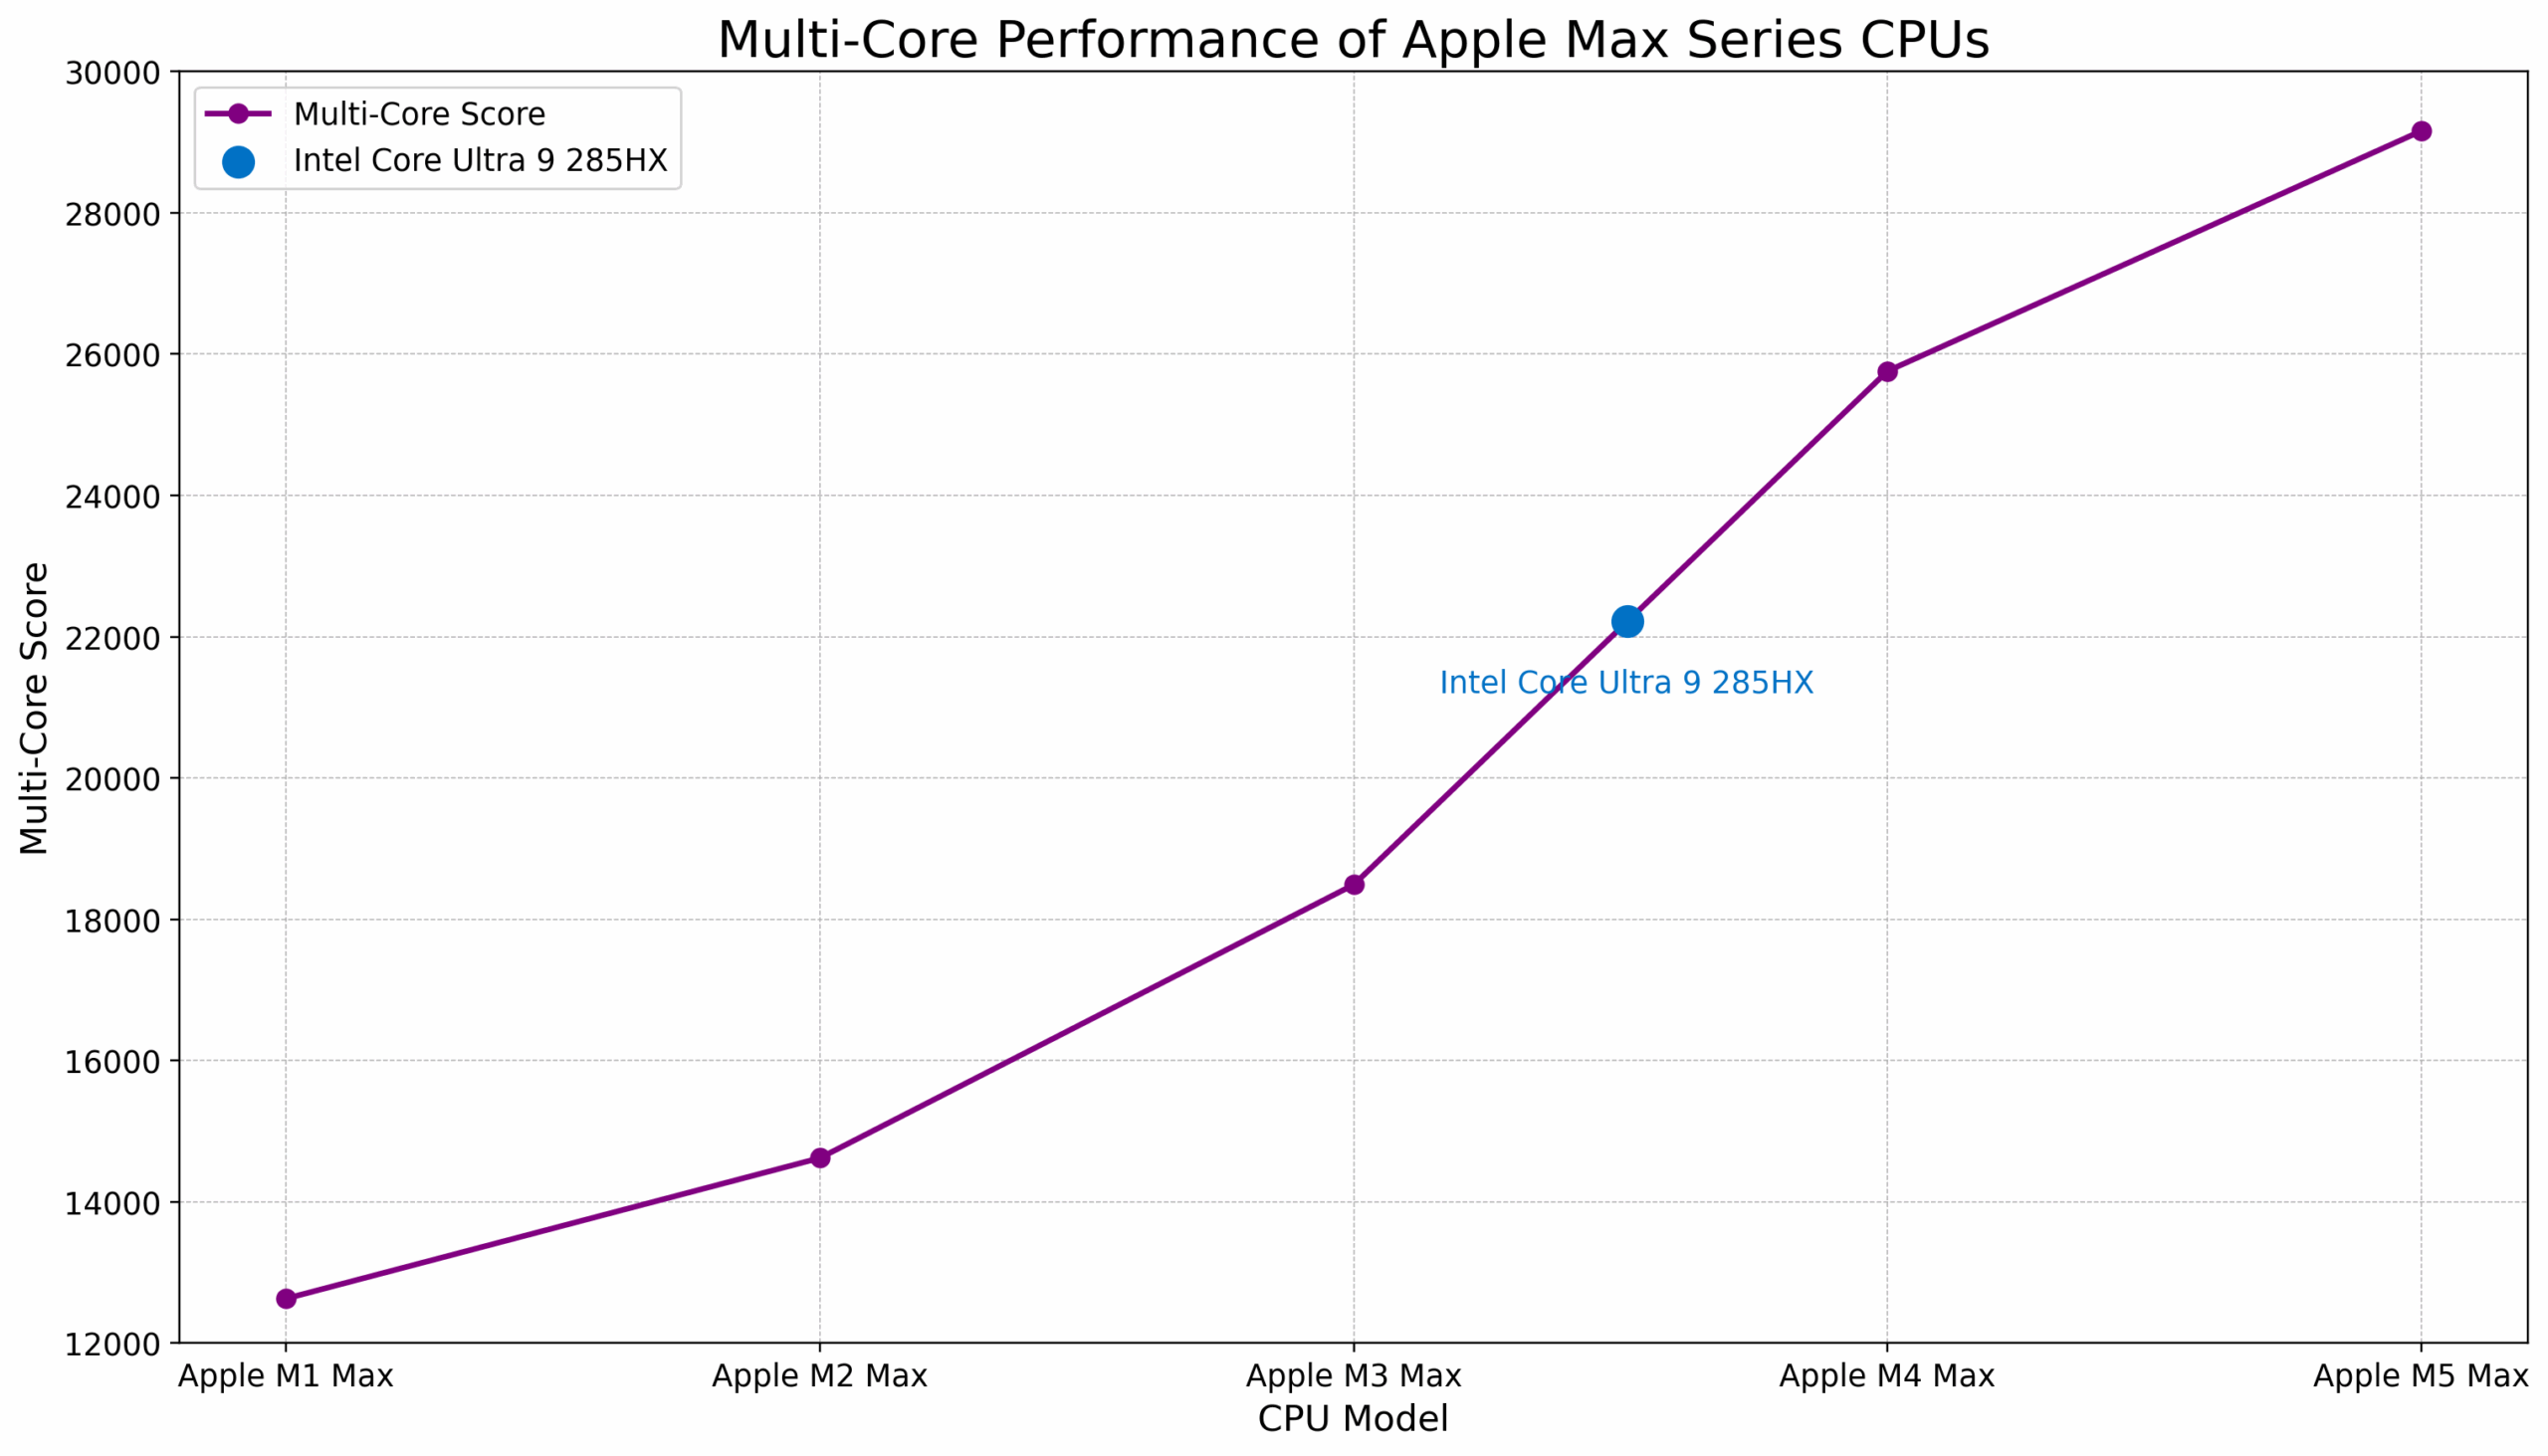
| CPU | ジークベンチ6 マルチコア | パフォーマンスジャンプ(%) |
| Apple M1 Max(10コアCPU) | 12 631 | |
| Apple M2 Max(12コアCPU) | 14 621 | +16% |
| Apple M3 Max(14コアCPU) | 18 490 | +26% |
| Apple M4 Max (16コアCPU) | 25 760 | +39% |
| Apple M5 Max (18コアCPU) | 29 159 | +13% |
| 平均パフォーマンスジャンプ24% | ||
アップルM1ウルトラ vs M2ウルトラ vs M3ウルトラ vs M4ウルトラおよびM5ウルトラ(予想)
編集[03/2025]: アップルM3ウルトラは予想よりかなり遅れてリリースされたが、ついに登場した!M4ウルトラの予想は33 773ポイントから37 867ポイントに、M5ウルトラの予想は42 864ポイントに上昇した!
Ultraチップは通常デスクトップ構成で使用されることを考慮し、モバイルIntel Core Ultra 9 285HXをデスクトップのフラッグシップIntel Core Ultra 9 285Kと入れ替えました。
その結果、M4 UltraはIntel Core Ultra 9 285Kより72%速くなり、M5 UltraはIntel Core Ultra 9 285Kの2倍速くなると予想される。もちろん、これはあくまで予想であり、M4 UltraやM5 Ultraを搭載するためには、アップルはおそらくMac Studioの設計を変更する必要があるだろう。
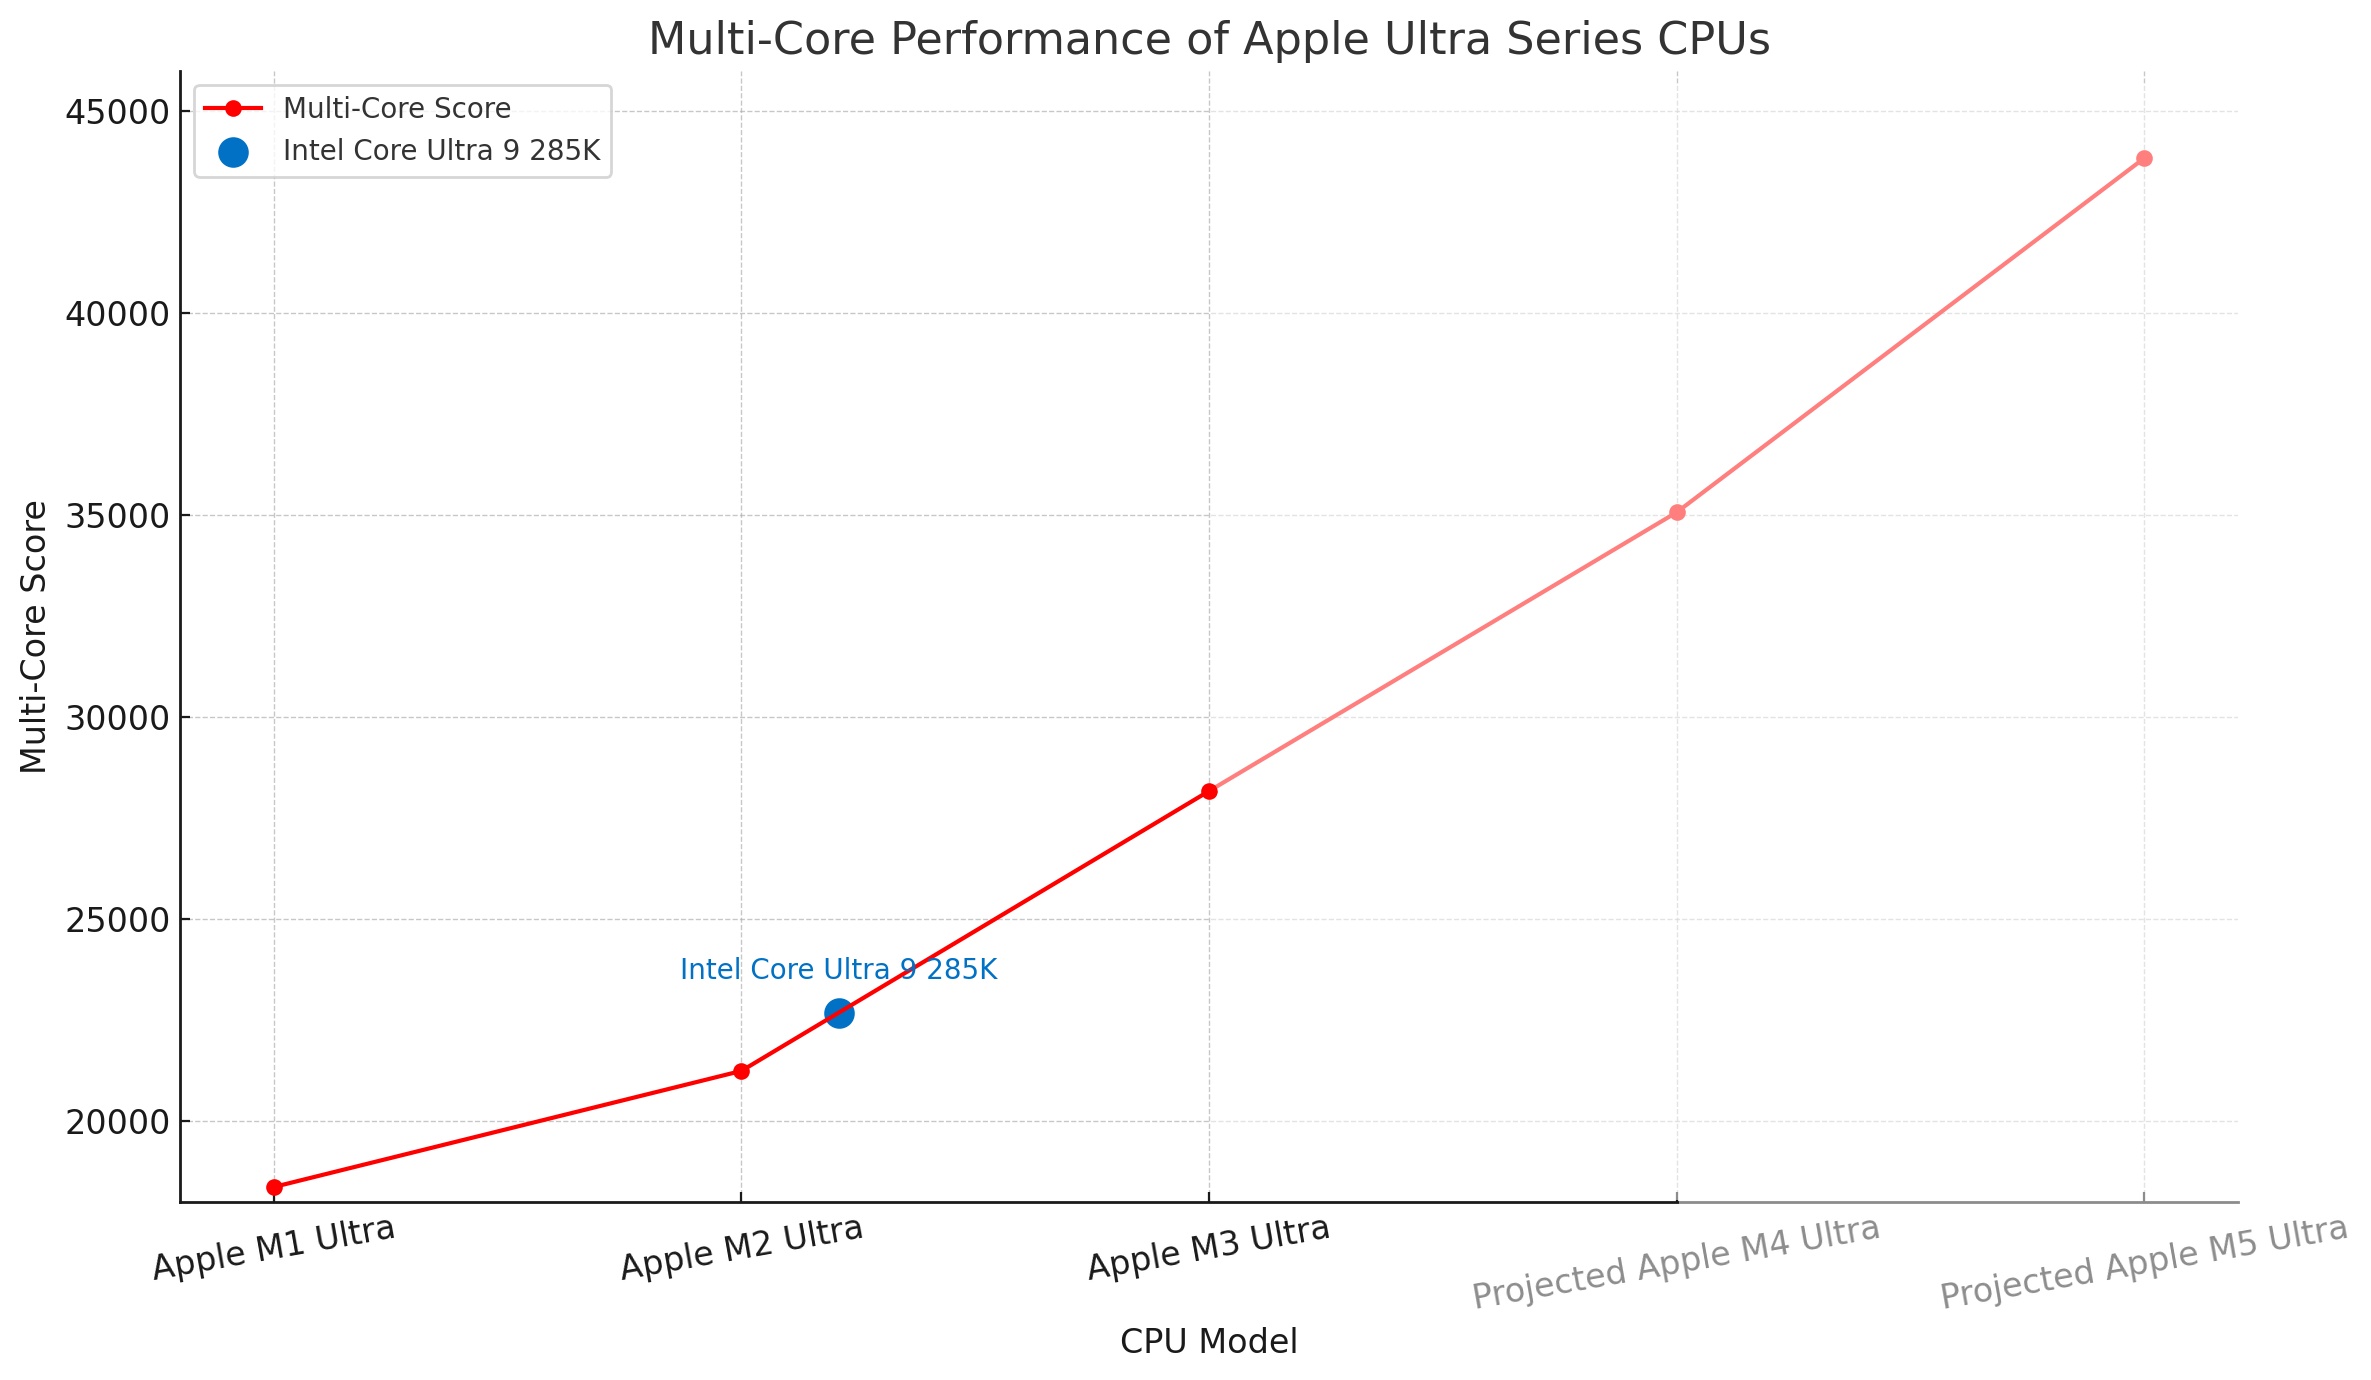
| CPU | ジークベンチ6 マルチコア | パフォーマンスジャンプ(%) |
| Apple M1 Ultra | 18 367 | |
| Apple M2 Ultra | 21 241 | +16% |
| アップル M3 ウルトラ | 28 169 | +33% |
| 予想Apple M4 Ultra | 37 867 | +34% |
| 予想Apple M5 Ultra | 42 864 | +13% |
| 平均パフォーマンスジャンプ25% | ||
究極の比較
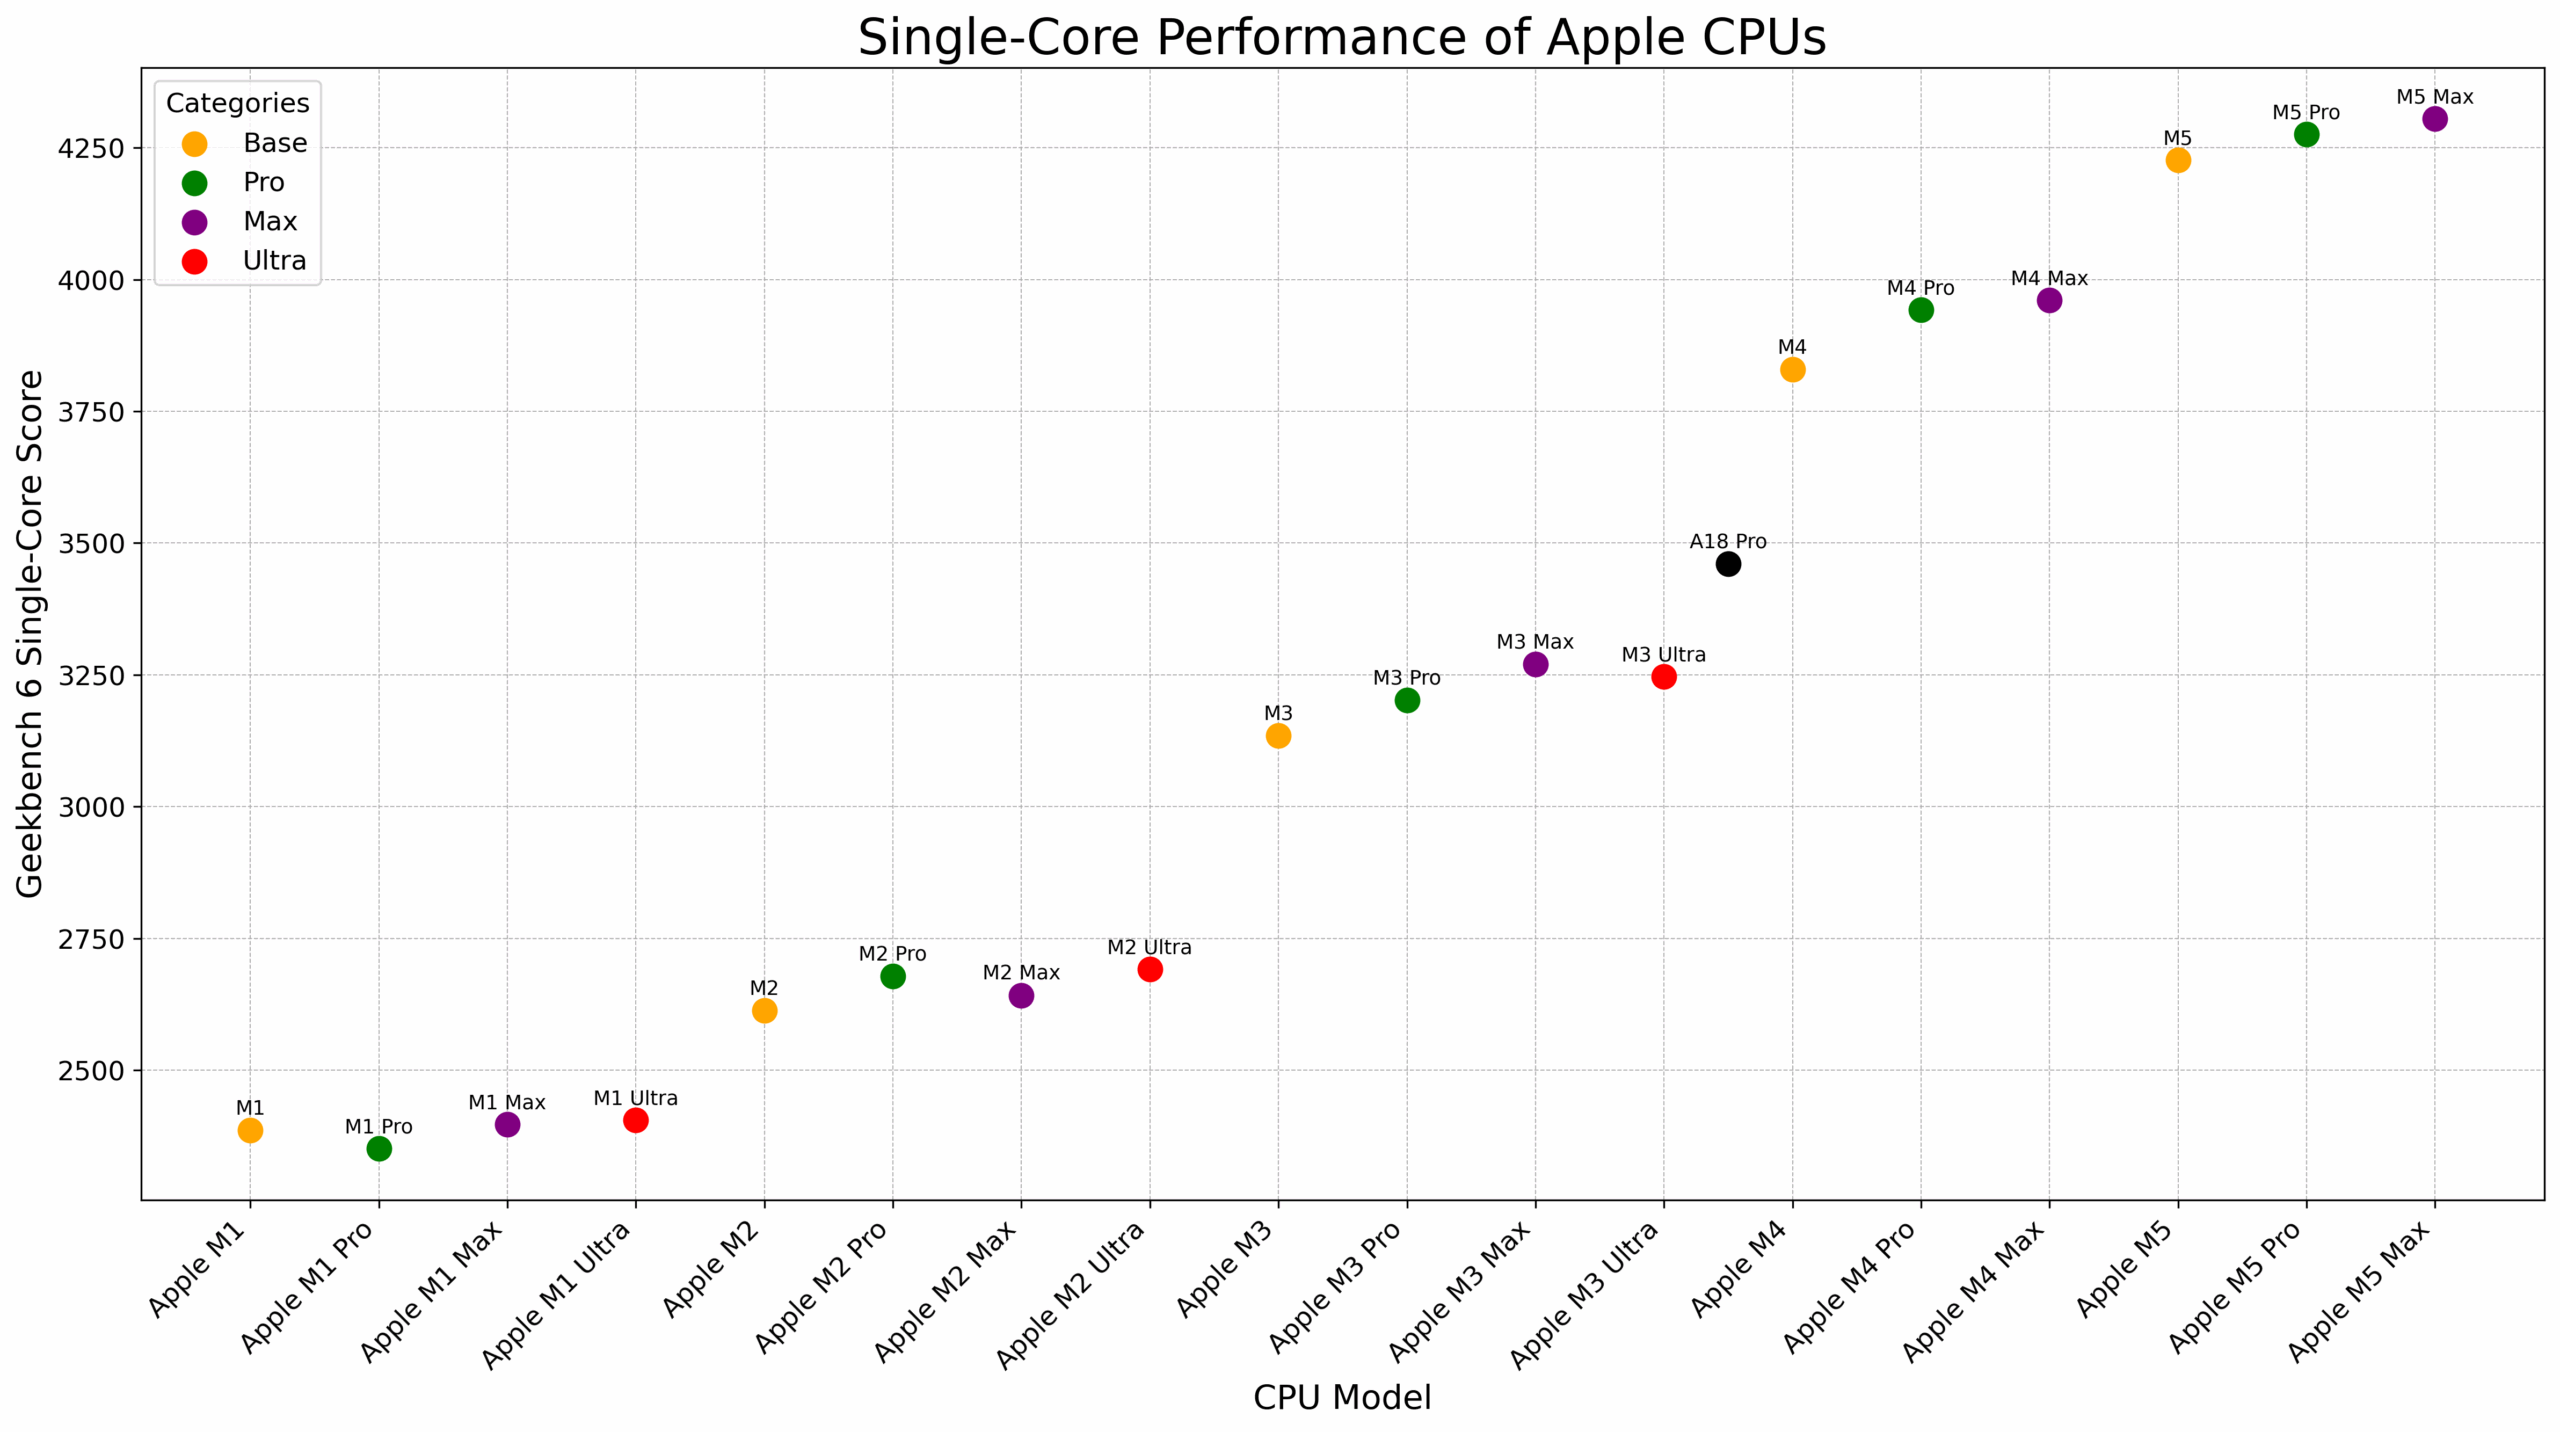
では、実際のデータを使って、すべてのアップルMシリーズCPUを徹底的に比較してみよう。
最新のアップルM5プロセッサーは、シングルコアのパワーでは最速のCPUです:
重い作業に関しては、Apple M5のマルチコア性能はM3 Max(14コア)の小型バリアントと同等で、M4 Pro(12コア)を14%下回る。しかし、M4 Maxのメモリ帯域幅(409.6GB/秒)は、M4(120GB/秒)の3~4倍、M2 Pro(204.8GB/秒)の2倍という驚異的な性能を誇り、AIプロジェクトに有益であることが証明されている。AIの王者はアップルM3 Ultraで、28,000以上のマルチコアスコア、819.3GB/秒のメモリ帯域幅を持つ。
M5 ProはM3 Ultraのマルチコア性能に匹敵し、M5 Maxはさらにパワフルだ:
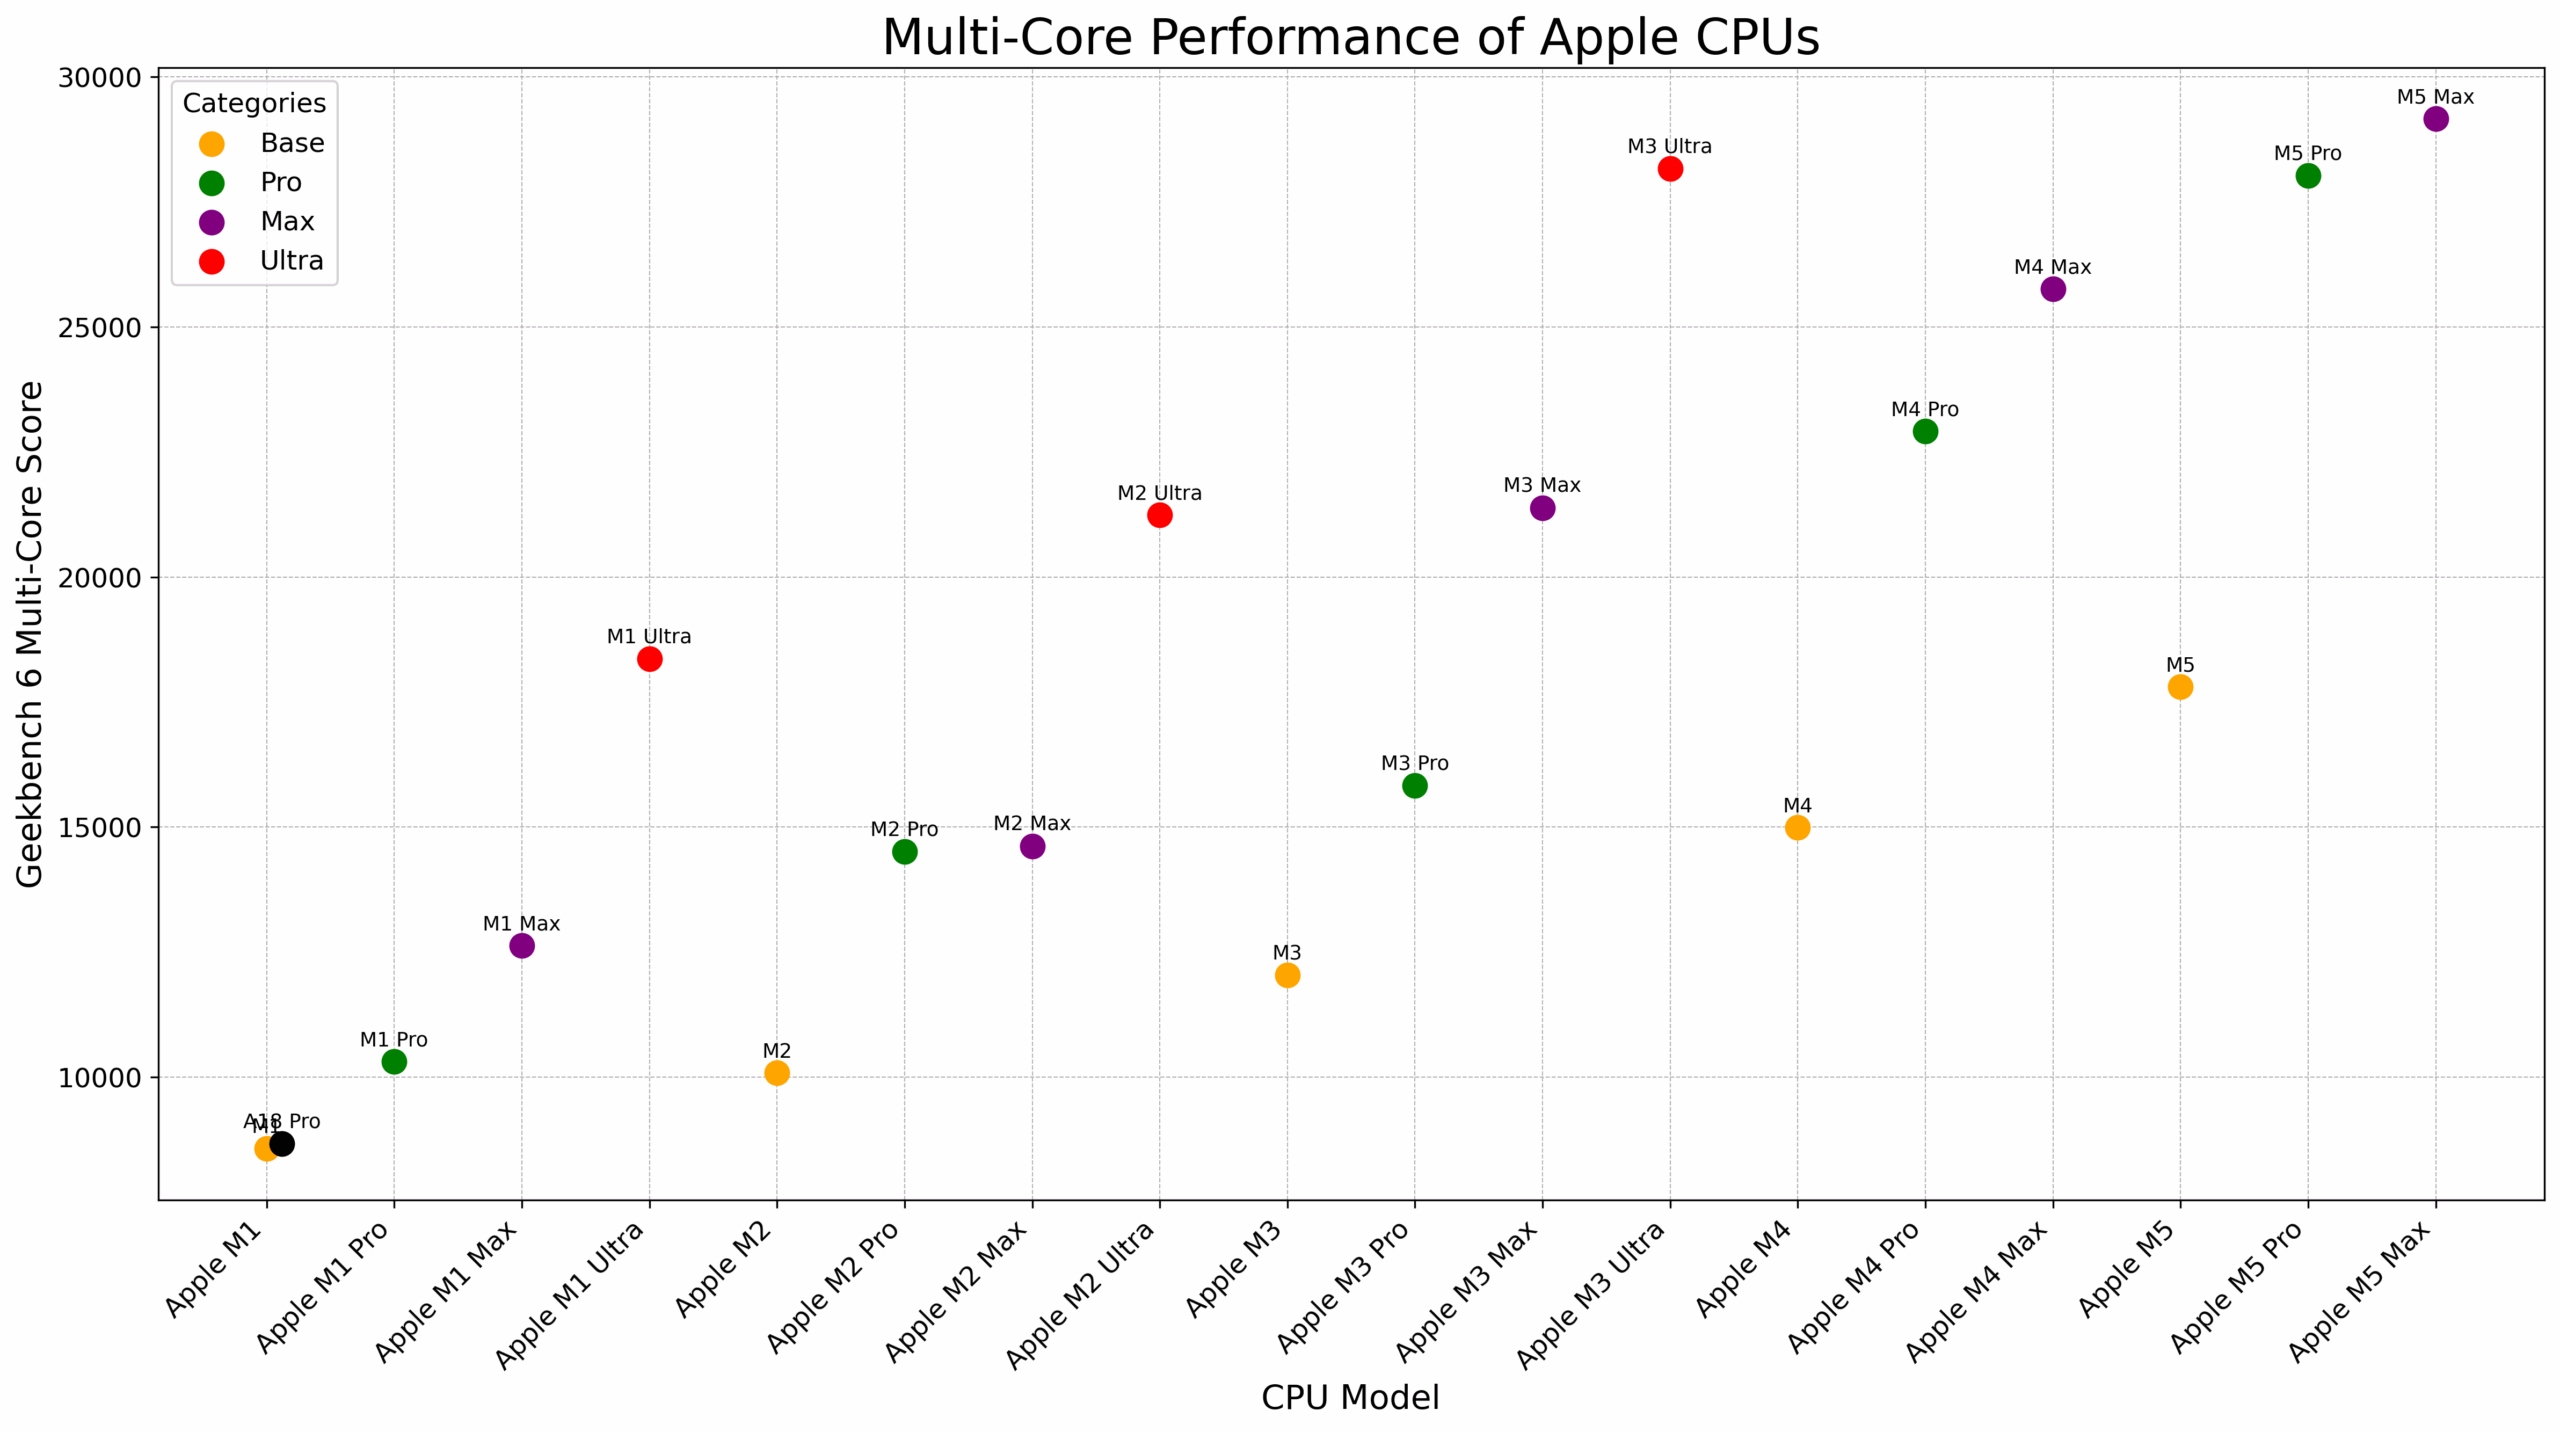
同じモデルで複数のバージョンが存在する場合は、上記で最高性能のCPUバリエーションのみを取り上げています。以下は、すべてのMシリーズ・プロセッサーとそのシングルコアおよびマルチコアのスコアの全リストです:
| CPU | シングルコア・スコア | マルチコア・スコア |
|---|---|---|
| Apple M5 Max(18コアCPU) | 4305 | 29159 |
| Apple M5 Pro(18コアCPU) | 4276 | 28030 |
| Apple M5 Pro(15コアCPU) | 未定 | 未定 |
| Apple M5(10コア) | 4227 | 17802 |
| Apple M5(9コア) | 4103 | 15308 |
| Apple M4 Max(16コア) | 3880 | 25760 |
| Apple M4 Max(14コア) | 3961 | 22725 |
| Apple M4 Pro(14コア) | 3943 | 22914 |
| Apple M4 Pro(12コア) | 3922 | 20622 |
| Apple M4(10コア) | 3830 | 14990 |
| Apple M4(9コア) | 3671 | 13381 |
| Apple M4(8コア) | 3650 | 13836 |
| Apple M3 Ultra(32コアCPU) | 3247 | 28169 |
| Apple M3 Ultra(28コアCPU) | 3244 | 27091 |
| Apple M3 Max(16コアCPU) | 3270 | 21385 |
| Apple M3 Max(14コアCPU) | 3109 | 18490 |
| Apple M3 Pro(12コアCPU) | 3202 | 15831 |
| Apple M3 Pro(11コアCPU) | 3067 | 14453 |
| Apple M3 (8コアCPU) | 3135 | 12042 |
| Apple M2 Ultra(24コアCPU) | 2691 | 21241 |
| Apple M2 Max(12コアCPU) | 2642 | 14621 |
| Apple M2 Pro(12コアCPU) | 2678 | 14511 |
| Apple M2 Pro(10コアCPU) | 2590 | 11455 |
| Apple M2(8コアCPU) | 2613 | 10082 |
| Apple M1 Ultra(20コアCPU) | 2405 | 18367 |
| Apple M1 Max(10コアCPU) | 2397 | 12631 |
| Apple M1 Pro(8コアCPU) | 2351 | 10307 |
| Apple M1(8コアCPU) | 2386 | 8571 |
このまとめが、どのMシリーズCPUを選ぶべきかの判断材料になれば幸いである。
また、他の分析もご参照ください:
ギャップが怖くなってきた:アップル、インテルに差をつけられる
もちろん、新登場のクアルコム Snapdragon X Eliteとの比較もお見逃しなく:
Apple M4 vs Snapdragon X Elite – 次世代CPUの戦い
 Author: Simeon NikolovEditor-in-Chief at LaptopMedia.com with 20+ years of experience in testing and analyzing laptops and mobile devices.

![[2026年8月] Amazon Global:ノートPC売上ランキングトップ10――Appleの「MacBook Neo」がチャートを席巻する一方、低価格帯および中価格帯のWindowsノートPCは販売台数をめぐって熾烈な争いを繰り広げている](https://laptopmedia.com/wp-content/uploads/2026/09/Best-Selling-Laptops-GLOBAL-Top-10-400x225.jpg)
![[2026年8月] Amazonグローバルにおけるノートパソコンのベストセラーブランド――売上高ではAppleが首位、機種の豊富さではHPがトップ](https://laptopmedia.com/wp-content/uploads/2026/09/GLOBAL-Best-Brands-400x225.jpg)
![[2026年8月] Amazon Global:ゲーム用ノートPC売上ランキングトップ10――HP Victus 15が首位を獲得、手頃な価格帯のモデルがランキングを席巻](https://laptopmedia.com/wp-content/uploads/2026/09/Best-Selling-Gaming-Laptops-GLOBAL-Top-10-400x225.jpg)
![[2026年8月] Amazon.co.jpで最も売れているノートパソコンブランド――Appleが販売台数の好調を背景に、市場シェアと売上高で首位を独占](https://laptopmedia.com/wp-content/uploads/2026/09/CO.JP-Best-Brands-1-400x225.jpg)
![[August 2026] Best-Selling Laptop Brands on Amazon USA – Apple Dominates Market Revenue and Volume Despite Lower Model Diversity](https://laptopmedia.com/wp-content/uploads/2026/09/COM-Best-Brands-1-400x225.jpg)
这个文章总结的太棒了,什么神仙编辑,把我想要的信息都罗列出来了
这条评论真是太温暖了,让我非常开心!谢谢你,Yesir!
—
That was the most heartwarming comment; it made my day! Thank you, Yesir!
Best Apple M chips analysis
Thank you very much, wu wei!
赞 赞 赞 加鸡腿
🙂 👍
incredible comparison design. any chance for gpu/npu?
Good idea!
Great article, would love to see update with GPU performance gain comparsion too
Perfect analysis. There are all I want to get!
Hello, I don’t get the comparison with i9-14900K .. it’s just purposely written and depicted to make apple chips better … In reality i9 cpu that was used as a reference point is on the top of the list
Check this out, bro, https://versus.com/en/intel-core-i9-14900hx-vs-intel-core-i9-14900k
I had a look at your chart which does not include the M5 and the graphs above are accurate.
The i9-14900K only beats the lower spec Apple chips at multi core performance and Cinebench. It trails everywhere else.
You seem to be going off the Crossmark Overall score which is distorted by the large number of No Value results for the Apple chips because some of the tests do not run on the Macs.
I had a look at your chart which does not include the M5 and the graphs above are accurate.
The i9-14900K only beats the lower spec Apple chips at multi core performance and Cinebench. It trails everywhere else.
You seem to be going off the Crossmark Overall score which is distorted by the large number of No Value results for the Apple chips because some of the tests do not run on the Macs.
Great effort for putting together such an extensive comparison. I only wish the Y-axis started at zero because at the moment, you’ve artificially amplified the true relative difference between all of them.
Thank you, WFR! While a zero-start axis is indeed the safest choice for showing absolute performance, my goal here was slightly different. I wanted to highlight the relative uplift between generations, using the M1 (2020) as a baseline, so readers can quickly judge “how big is the jump from what I have to what I’m considering” (with the added context of Intel CPUs as well). I initially tried charts starting at zero, but the bars became compressed and the differences between closer generations were much harder to read at a glance. For example, if you’re on M4 and mostly care… 続きを読む »
You do not show the relative uplift if you chop off the lower part of the graph.
For relative values you HAVE to show the whole enchalada, not the clipped M4 minus M1 which make the M1 zero value.
The % uplift you show in the figures actually works off the WHOLE value not a clipped value.
It would be great to have all M series Apple silicon GPU benchmarks.
每次都看这个总结,各种对比数据太清晰了,期待m5pro和max的加入,感谢你的付出
Thank you! The new models are coming to our lab, stay tuned for full analysis and reviews!
—-
谢谢!新模型即将送达我们的实验室,敬请期待完整的分析和评测!
Amazing! I was just about to do a spreadsheet on exactly this and found this site immediately. Thanks for the great work. 😃👏 All that’s missing is a “Bangs for Bucks chart” with the performance rated against price for each model. Just one suggestion. The Charts are too big for the information. If they were smaller you could take in all the information withouy scrolling. You should always start charts them from zero clipping them does not show the correct relativity. For the pricing I’d tilt the charts to axonometric view with $ as the height off the chart. We… 続きを読む »
It would be even better if there were a graphics performance rating.
This is the most detailed and best article I have ever seen! This has provided me with great help in choosing m chips. Thank you so much!