[Comparison] AMD Radeon RX 5300M vs NVIDIA GeForce GTX 1660 Ti (Laptop) – the 1660 Ti looks unstoppable when compared to the RX 5300M
 With the RX 5300M winning most of our GPU comparisons, it’s time we up the challenge a little, or maybe a lot. That is why for today we have the RX 5300M go up against the GTX 1660 Ti, which should provide an amazing opportunity for the RX 5300M to sweat it up and actually have to put some effort towards winning these comparisons.
You can visit our Top Laptop Graphics Ranking, where we have the best GPUs for laptops, going from best to worst.
You can find more information about both GPUs here: AMD Radeon RX 5300M / NVIDIA GeForce GTX 1660 Ti (Laptop)
Specs table
| Radeon RX 5300M | GeForce GTX 1660 Ti (Laptop) | |
|---|---|---|
| Architecture | Navi | Turing |
| Lithography | 7 nm | 12 nm |
| Base / Max Frequency | 1181MHz / 1445MHz | 1455MHz / 1590MHz |
| Memory Type | GDDR6-14000MHz | GDDR6-12000MHz |
| Memory capacity | 3GB | 6GB |
| Cores | 1408 | 1536 |
| Power Consumption | 65W | 80W |
| Memory bus | 96-bit | 192-bit |
| Memory bandwidth | 168 GB/sec | 288 GB/sec |
GPU benchmarks
The GTX 1660 Ti absolutely outperformed the RX 5300M, regardless of the benchmark, or even the game. In 3DMark Fire Strike it was 41% faster. In Unigine Heaven 4.0, the NVIDIA GPU showed 74% better performance. For the last benchmark, which is Unigine Superposition, the GTX 1660 Ti scored 62% higher. The same story followed in the gaming tests, with the GTX 1660 Ti being on average 29%, 34%, 25%, and 42% better in FarCry 5, Rise of the Tomb Raider, Shadow of the Tomb Raider, and Tom Clancy’s Ghost Recon: Wildlands, respectively.
結果は3DMark Time Spy (Graphics)のものです。数値が高いほど良い。
結果は3DMark Fire Strike (Graphics)ベンチマークのものです(スコアが高いほど良い)
結果はUnigine Superpositionベンチマークのものです(スコアが高いほど良い)
Gaming tests

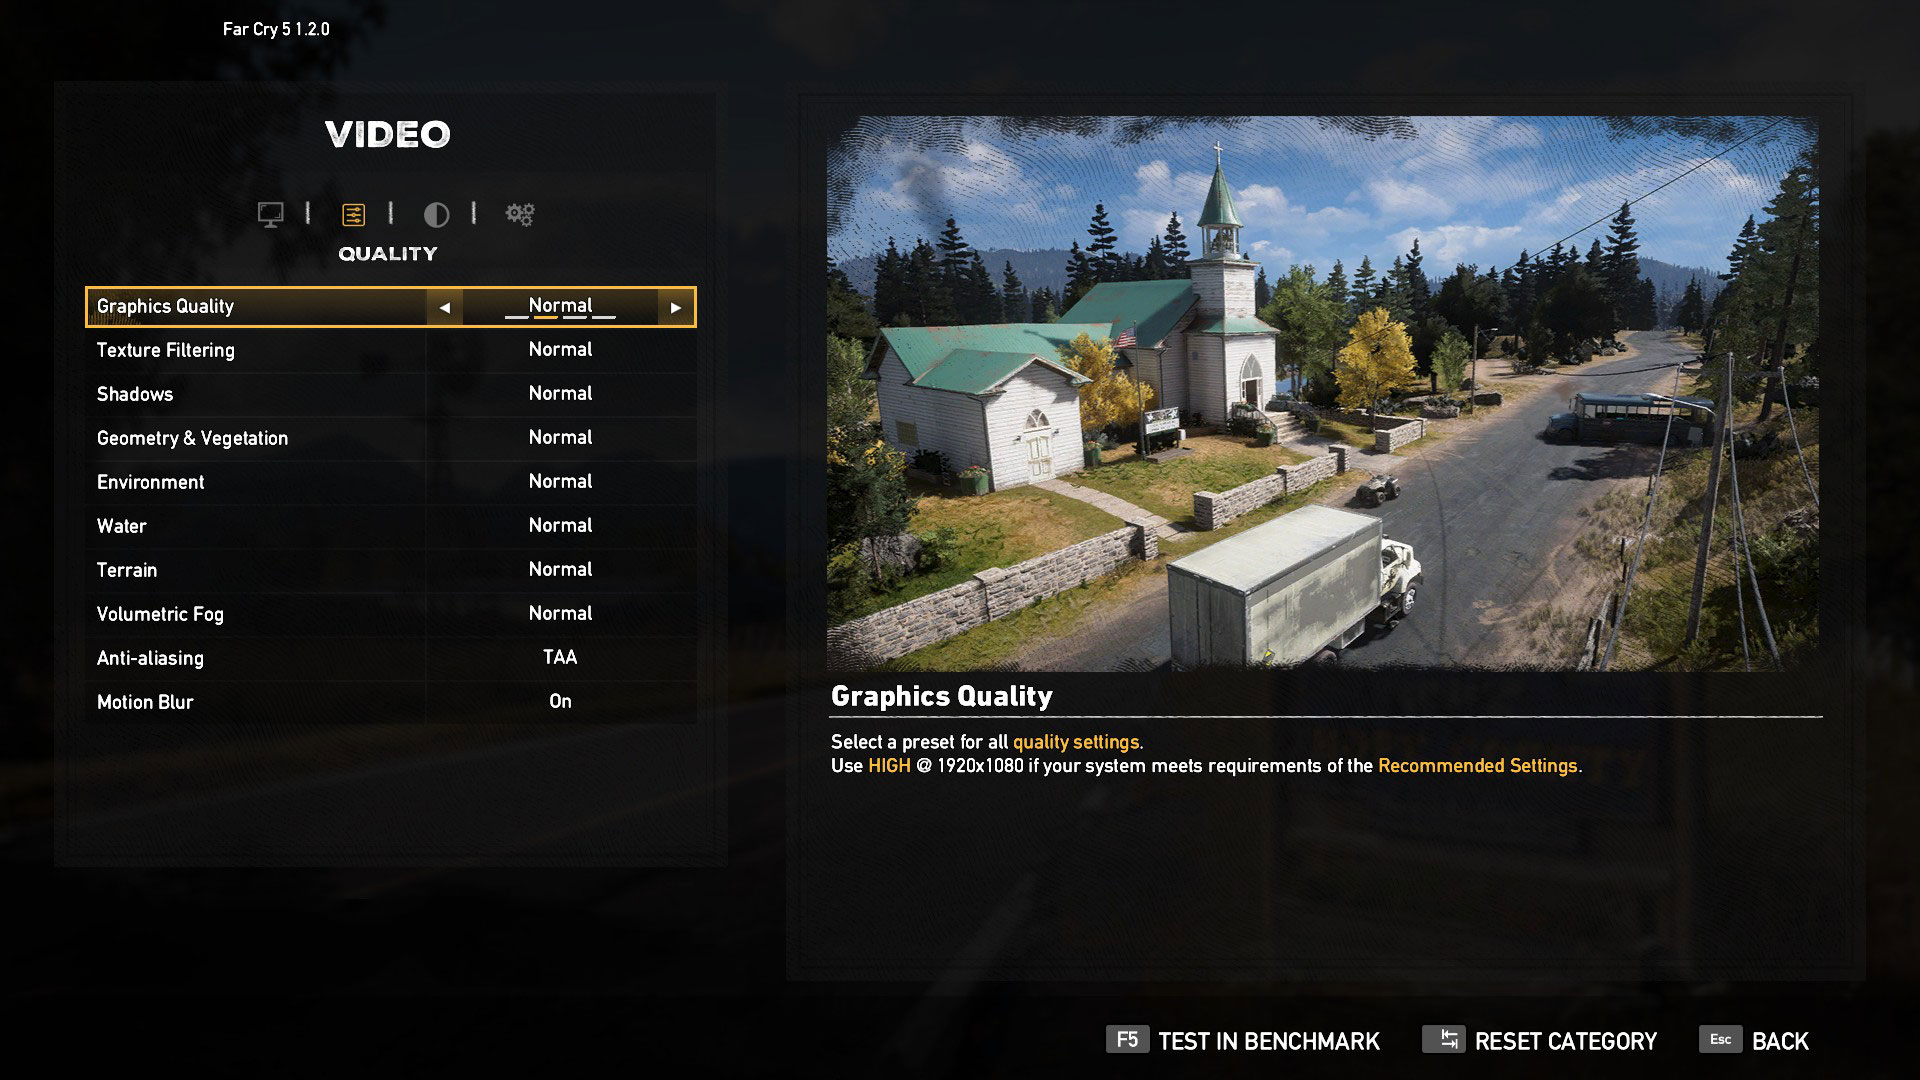
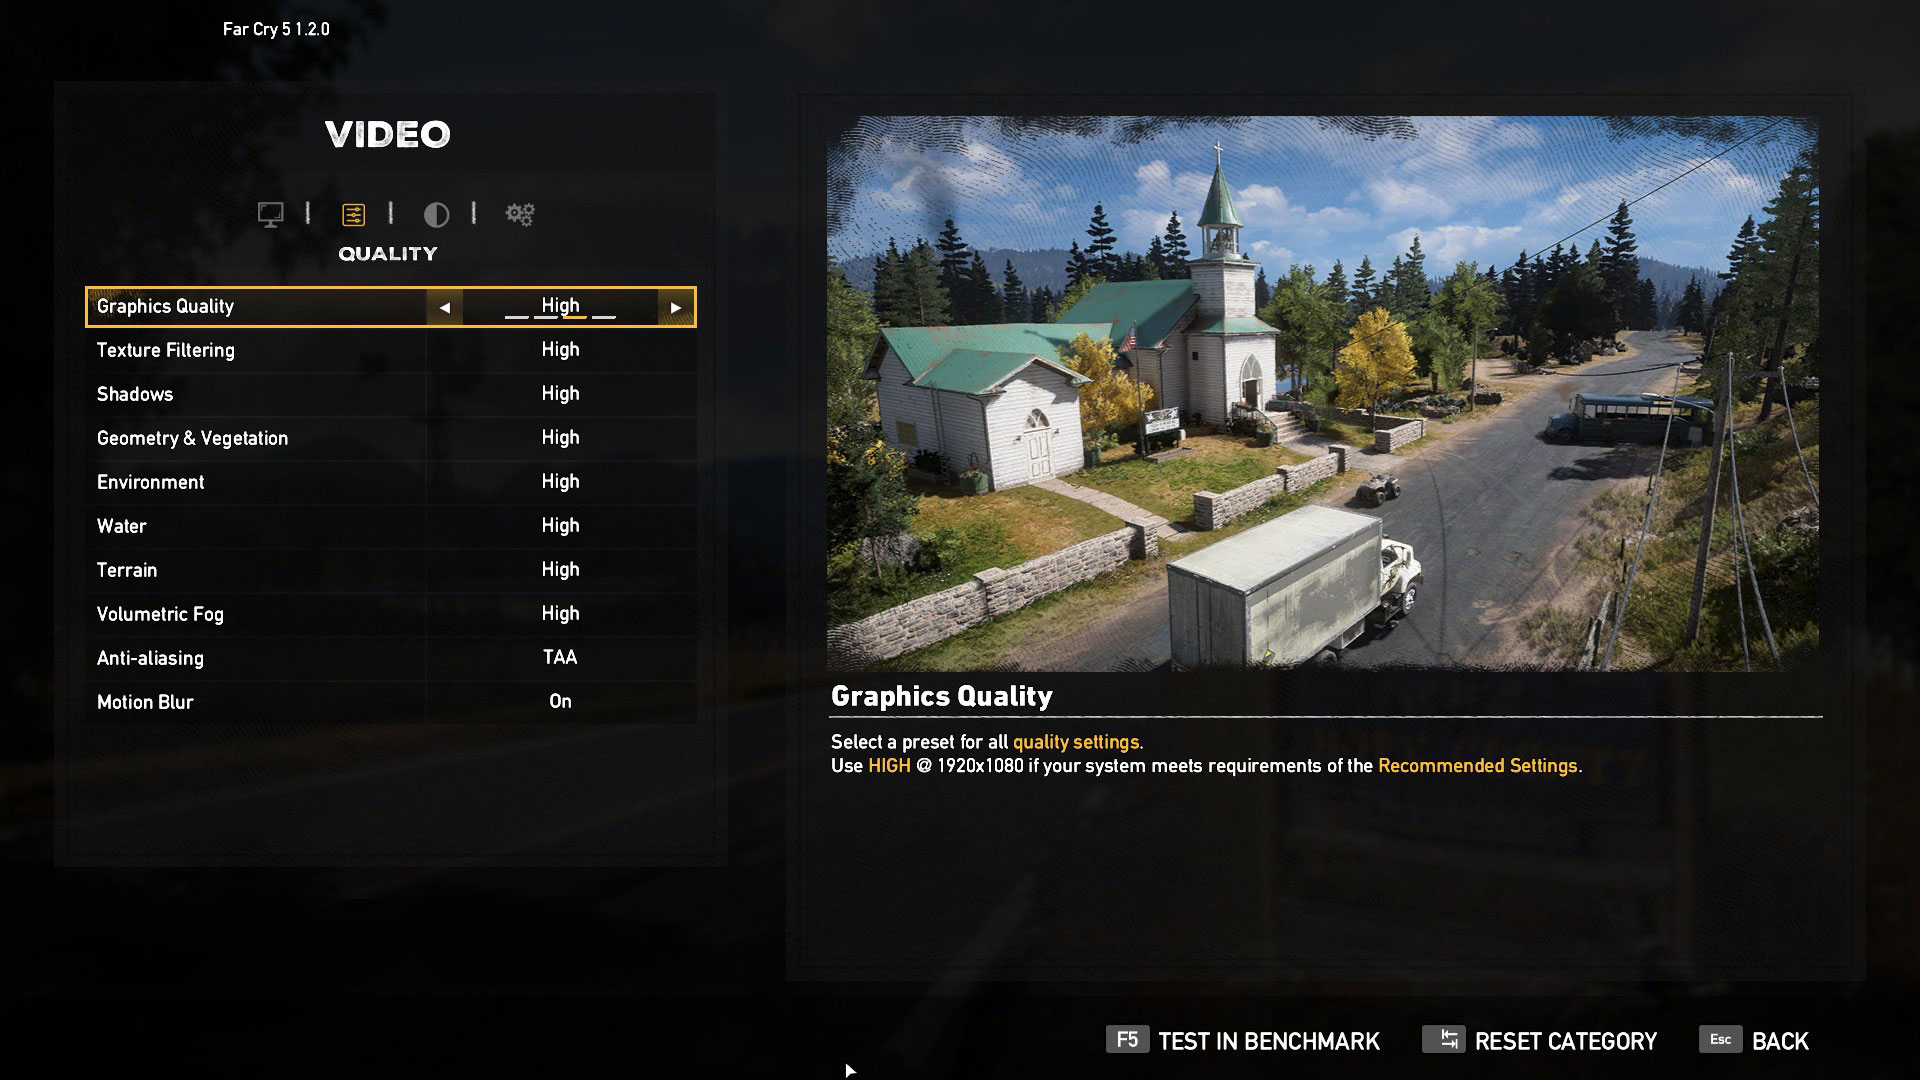
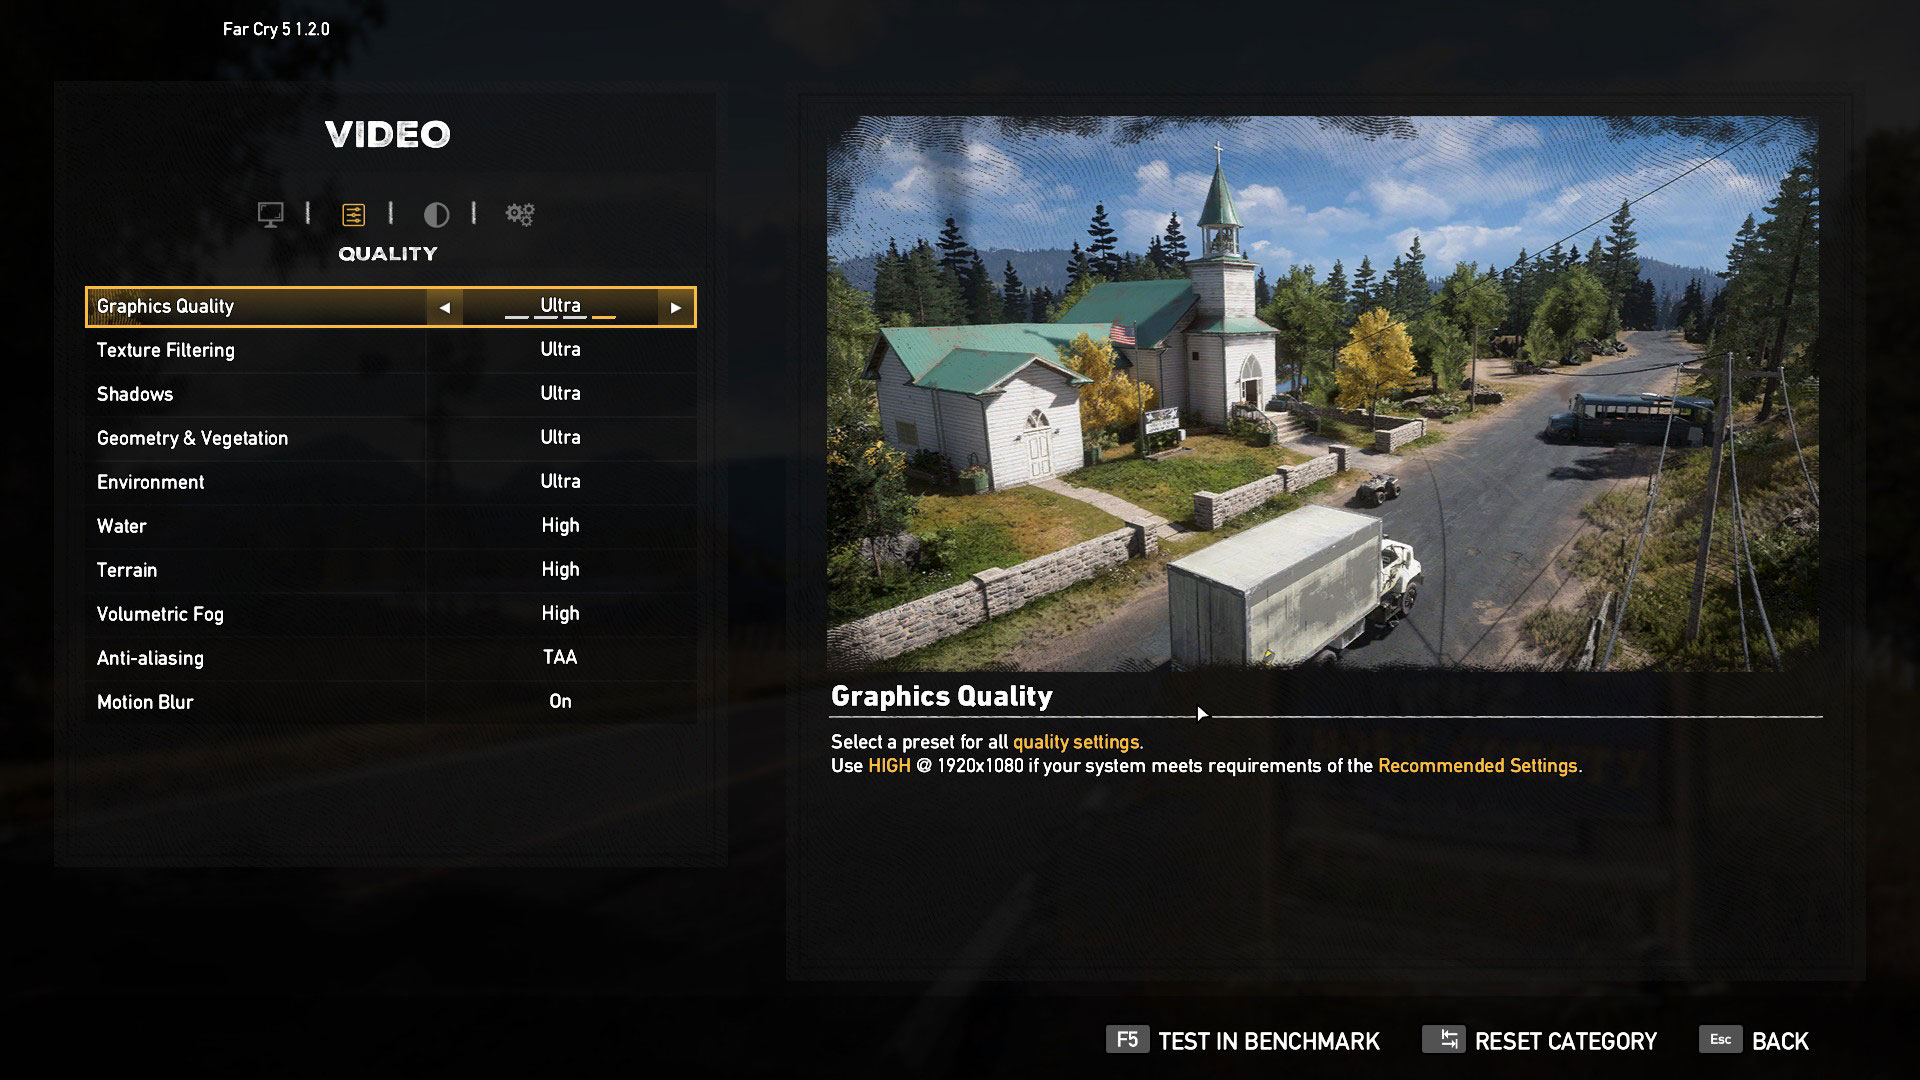
| Far Cry 5 | Full HD, Normal (Check settings) | Full HD, High (Check settings) | Full HD, Ultra (Check settings) |
|---|---|---|---|
| Radeon RX 5300M | 72 fps | 62 fps | 55 fps |
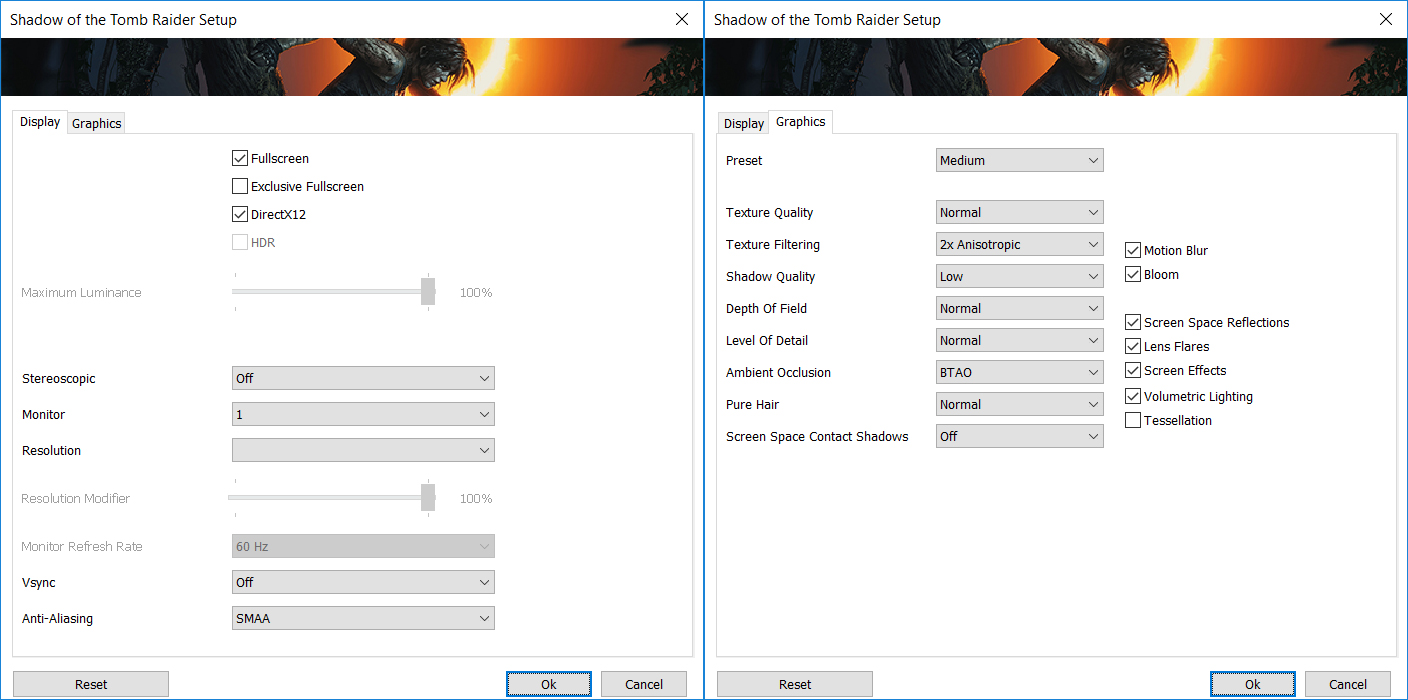
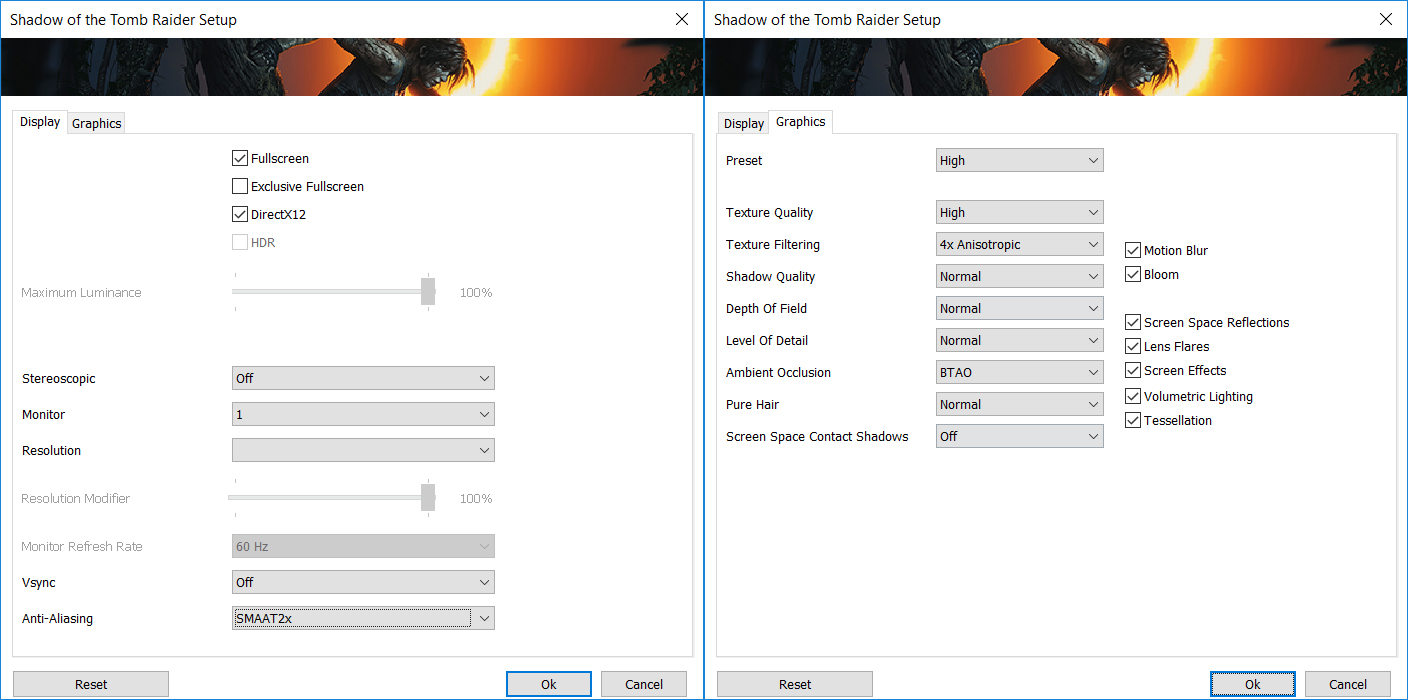
| GeForce GTX 1660 Ti (Laptop) | 84 fps (+17%) | 81 fps (+31%) | 77 fps (+40%) |

| Rise of the Tomb Raider (2016) | Full HD, Lowest (Check settings) | Full HD, Medium (Check settings) | Full HD, Very High (Check settings) |
|---|---|---|---|
| Radeon RX 5300M | 115 fps | 85 fps | 43 fps |
| GeForce GTX 1660 Ti (Laptop) | 144 fps (+25%) | 107 fps (+26%) | 65 fps (+51%) |

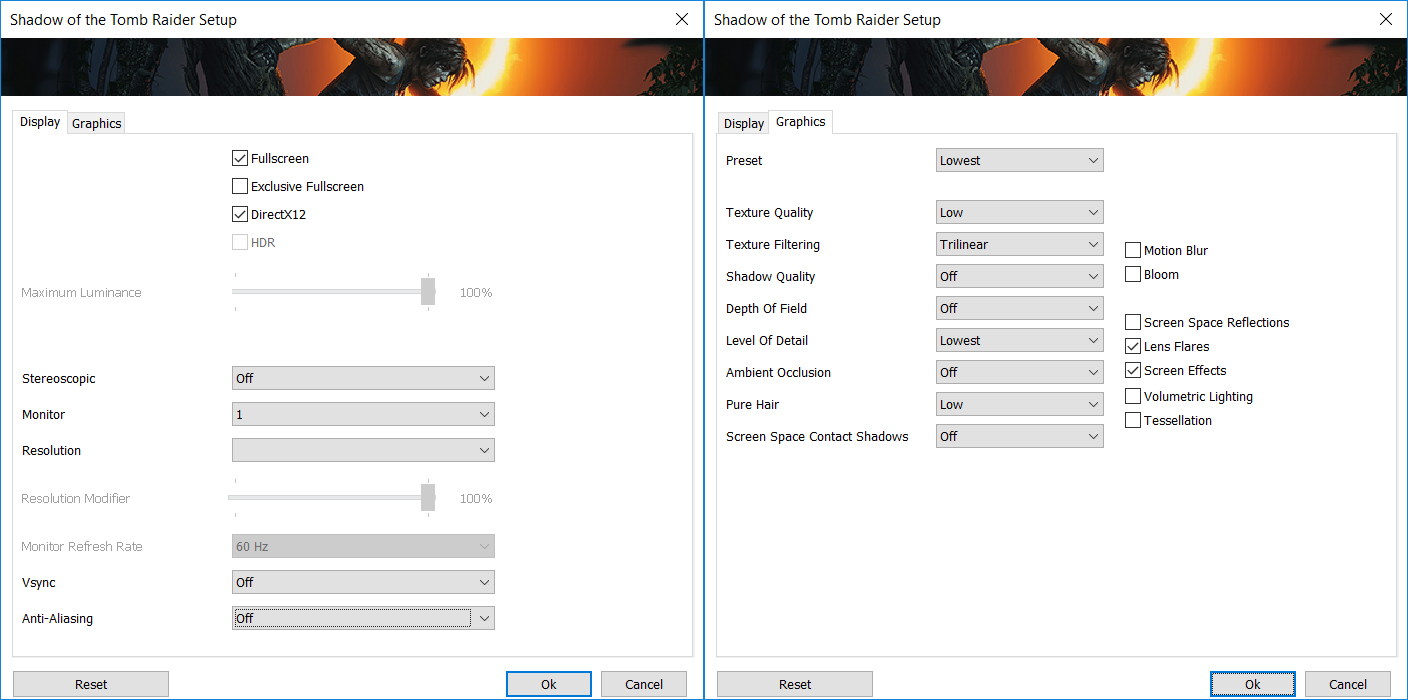
| Shadow of the Tomb Raider (2018) | Full HD, Lowest (Check settings) | Full HD, Medium (Check settings) | Full HD, High (Check settings) |
|---|---|---|---|
| Radeon RX 5300M | 87 fps | 55 fps | 49 fps |
| GeForce GTX 1660 Ti (Laptop) | 123 fps (+41%) | 73 fps (+33%) | 50 fps (+2%) |

| Tom Clancy’s Ghost Recon Wildlands | Full HD, Medium (Check settings) | Full HD, High (Check settings) | Full HD, Very High (Check settings) |
|---|---|---|---|
| Radeon RX 5300M | 63 fps | 58 fps | 46 fps |
| GeForce GTX 1660 Ti (Laptop) | 93 fps (+48%) | 85 fps (+47%) | 60 fps (+30%) |
Conclusion
It was about time that the RX 5300M suffered its first major loss. The GTX 1660 Ti completely dominated it, regardless of what benchmark or game we decided to put both of them through. The performance gains were quite large, with some of them nearing or even excelling 50%. The GTX 1660 Ti is still a beast in the mid-range market, and it should never be underestimated.
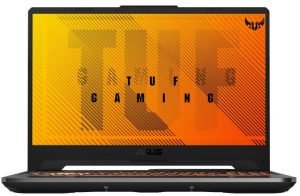
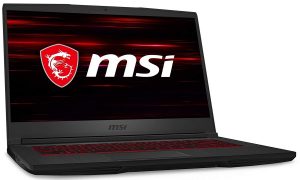
All laptops with the AMD Radeon RX 5300M:
All laptops with the NVIDIA GeForce GTX 1660 Ti:
 Author: Severin Kolakov

![[2026年6月] Amazonグローバルにおけるノートパソコンのベストセラーブランド ― 販売台数と売上高の両面で、Appleが圧倒的な優位性を示す](https://laptopmedia.com/wp-content/uploads/2026/07/GLOBAL-Best-Brands-400x225.jpg)
![[2026年6月] アマゾン・グローバル:ノートパソコン売上ランキングトップ10――Appleの新型「MacBook Neo」が1位に躍り出て、手頃な価格帯で市場を再編](https://laptopmedia.com/wp-content/uploads/2026/07/Best-Selling-Laptops-GLOBAL-Top-10-400x225.jpg)
![[2026年6月] アマゾン・グローバル:ゲーム用ノートPC売上ランキングトップ10――エイサーの「Nitro V 16S AI」が販売台数で首位を独占、ASUSが総売上高で首位に立つ](https://laptopmedia.com/wp-content/uploads/2026/07/Best-Selling-Gaming-Laptops-GLOBAL-Top-10-400x225.jpg)
![[2026年6月] AmazonにおけるノートPC用GPUの世界販売ランキング ― NVIDIA RTX 5060が専用GPU部門で首位を獲得](https://laptopmedia.com/wp-content/uploads/2026/07/Best-Selling-GPUs-GLOBAL-Top-10-400x225.jpg)
![[2026年6月] AmazonにおけるノートPC用CPUの世界販売ランキング ― Apple M5が首位を独占、AMD Ryzen 7 260がプレミアム層で堅調なシェアを獲得](https://laptopmedia.com/wp-content/uploads/2026/07/Best-Selling-CPUs-GLOBAL-Top-10-400x225.jpg)