Apple M5 vs M4, M3, M2, M1 (+Pro/Max/Ultra): Volledige vergelijking!
Apple heeft zijn CPU’s uit de M-serie zo ontworpen dat ze werken als legoblokjes, waardoor ze aan elkaar gekoppeld kunnen worden en er nog sterkere chips ontstaan. Zo zijn de M-Ultra chips in wezen twee M-Max CPU’s gecombineerd, waarmee ze hun kracht verdubbelen om elke Intel en AMD CPU uit te dagen. Vandaag ligt de focus echter niet op Team Blauw en Team Rood, maar vergelijken we alle vier de generaties M-serie processors.
Daarnaast geven we de verwachte scores voor de Apple M5 Pro, M5 Max en M5 Ultra, en natuurlijk voor de ontbrekende M4 Ultra. Aan de slag!
[01/2025] Bijgewerkt: Apple M4 (8-core CPU), M4 (10-core CPU), M4 Pro (12-core CPU), M4 Pro (14-core CPU), M4 Max (14-core CPU) en M4 Max (16-core CPU) toegevoegd.
[03/2025] Bijgewerkt: Apple M3 Ultra toegevoegd
[11/2025] Bijgewerkt: Apple M5 (9-core en 10-core) toegevoegd
[03/2026] Bijgewerkt: A18 Pro, Apple M5 Pro (15-core en 18-core) en Apple M5 Max toegevoegd
Apple CPU lineup – De volledige lijst
Elke nieuwe generatie Apple chips brengt aanzienlijke verbeteringen met zich mee, aangezien Apple elk jaar krachtigere en efficiëntere architecturen introduceert:
| Apple SoC | Super/prestaties/efficiëntie Kernen | GPU-Kernen | Geheugen Bandbreedte | Transistors |
| Apple M5 Max (CPU met 18 cores, GPU met 40 cores) | 6S+12P | 40 | 614 GB/s | – |
| Apple M5 Max (CPU met 18 cores, GPU 32c) | 6S+12P | 32 | 460 GB/s | – |
| Apple M5 Pro (CPU met 18 cores) | 6S+12P | 20 | 307 GB/s | – |
| Apple M5 Pro (15-core CPU) | 5S+10P | 16 | 307 GB/s | – |
| Apple M5 (10-core CPU) | 4P+6E | 10 | 153 GB/s | – |
| Apple A18 Pro (MacBook Neo) | 2P+4E | 5 | 60 GB/s | – |
| Apple M5 (9-core CPU) | 3P+6E | 10 | 153 GB/s | – |
| Apple M4 Max (16-core CPU) | 12P+4E | 40 | 546 GB/s | – |
| Apple M4 Max (CPU met 14 cores) | 10P+4E | 32 | 410 GB/s | – |
| Apple M4 Pro (CPU met 14 cores) | 10P+4E | 20 | 273 GB/s | – |
| Apple M4 Pro (CPU met 12 cores) | 8P+4E | 16 | 273 GB/s | – |
| Apple M4 (CPU met 10 cores) | 4P+6E | 10 | 120 GB/s | 28 miljard |
| Apple M4 (9-core CPU) | 3P+6E | 8 | 120 GB/s | 28 miljard |
| Apple M4 (8-core CPU) | 4P+4E | 8 | 120 GB/s | 28 miljard |
| Apple M3 Ultra (32-core CPU) | 24P+8E | 80 | 819,3 GB/s | 184 miljard |
| Apple M3 Ultra (CPU met 28 cores) | 20P+8E | 60 | 819,3 GB/s | 184 miljard |
| Apple M3 Max (16-core CPU) | 12P+4E | 30 of 40 | 408,6 GB/s | 92 miljard |
| Apple M3 Max (CPU met 14 cores) | 10P+4E | 30 of 40 | 307,2 GB/s | 92 miljard |
| Apple M3 Pro (12-core CPU) | 6P+6E | 14 of 16 | 153,6 GB/s | 37 miljard |
| Apple M3 Pro (CPU met 11 cores) | 5P+6E | 14 of 16 | 153,6 GB/s | 37 miljard |
| Apple M3 (CPU met 8 cores) | 4P+4E | 8 of 10 | 102,4 GB/s | 25 miljard |
| Apple M2 Ultra (CPU met 24 cores) | 16P+8E | 60 of 76 | 819,2 GB/s | 134 miljard |
| Apple M2 Max (12-core CPU) | 8P+4E | 30 of 38 | 409,6 GB/s | 67 miljard |
| Apple M2 Pro (12-core CPU) | 6P+4E | 16 of 19 | 204,8 GB/s | 40 miljard |
| Apple M2 Pro (10-core CPU) | 6P+4E | 16 of 19 | 204,8 GB/s | 40 miljard |
| Apple M2 (CPU met 8 cores) | 4P+4E | 8 of 10 | 102,4 GB/s | 20 miljard |
| Apple M1 Ultra (CPU met 20 cores) | 16P+4E | 64 | 819,2 GB/s | 114 miljard |
| Apple M1 Max (10-core CPU) | 8P+2E | 24 of 32 | 409,6 GB/s | 57 miljard |
| Apple M1 Pro (10-core CPU) | 8P+2E | 16 | 204,8 GB/s | 33,7 miljard |
| Apple M1 Pro (8-core CPU) | 6P+2E | 14 | 204,8 GB/s | 33,7 miljard |
| Apple M1 (8-core CPU) | 4P+4E | 7 of 8 | 68,3 GB/s | 16 miljard |
Apple M1 vs M2 vs M3 vs M4 vs M5
Laten we eerst de progressie van de “basisvariant” van de M-serie CPU’s bekijken.
Hieronder vind je een overzicht van de single-core prestaties van deze basisvarianten, met prestatiescores en procentuele verbeteringen van de opeenvolgende generaties.
Single-core prestaties
Single-core prestaties zijn cruciaal voor het leveren van optimale snelheid in toepassingen die sterk afhankelijk zijn van de kernsnelheid van de processor, zoals gaming of het compileren van software. Het speelt ook een belangrijke rol bij het bepalen van de algehele reactiesnelheid en efficiëntie van besturingssystemen en hulpprogramma’s, waardoor een soepele gebruikerservaring wordt gegarandeerd, zelfs wanneer multi-core optimalisatie niet beschikbaar is.
We voegen ter referentie de best presterende Intel-chip toe in onze Top Laptop CPU Ranking, de Intel Core Ultra 9 285HX (3124 punten). Deze komt bijna perfect overeen met de Apple M3. De Apple A18 Pro in de MacBook Neo zit net tussen M3 en M4 in.
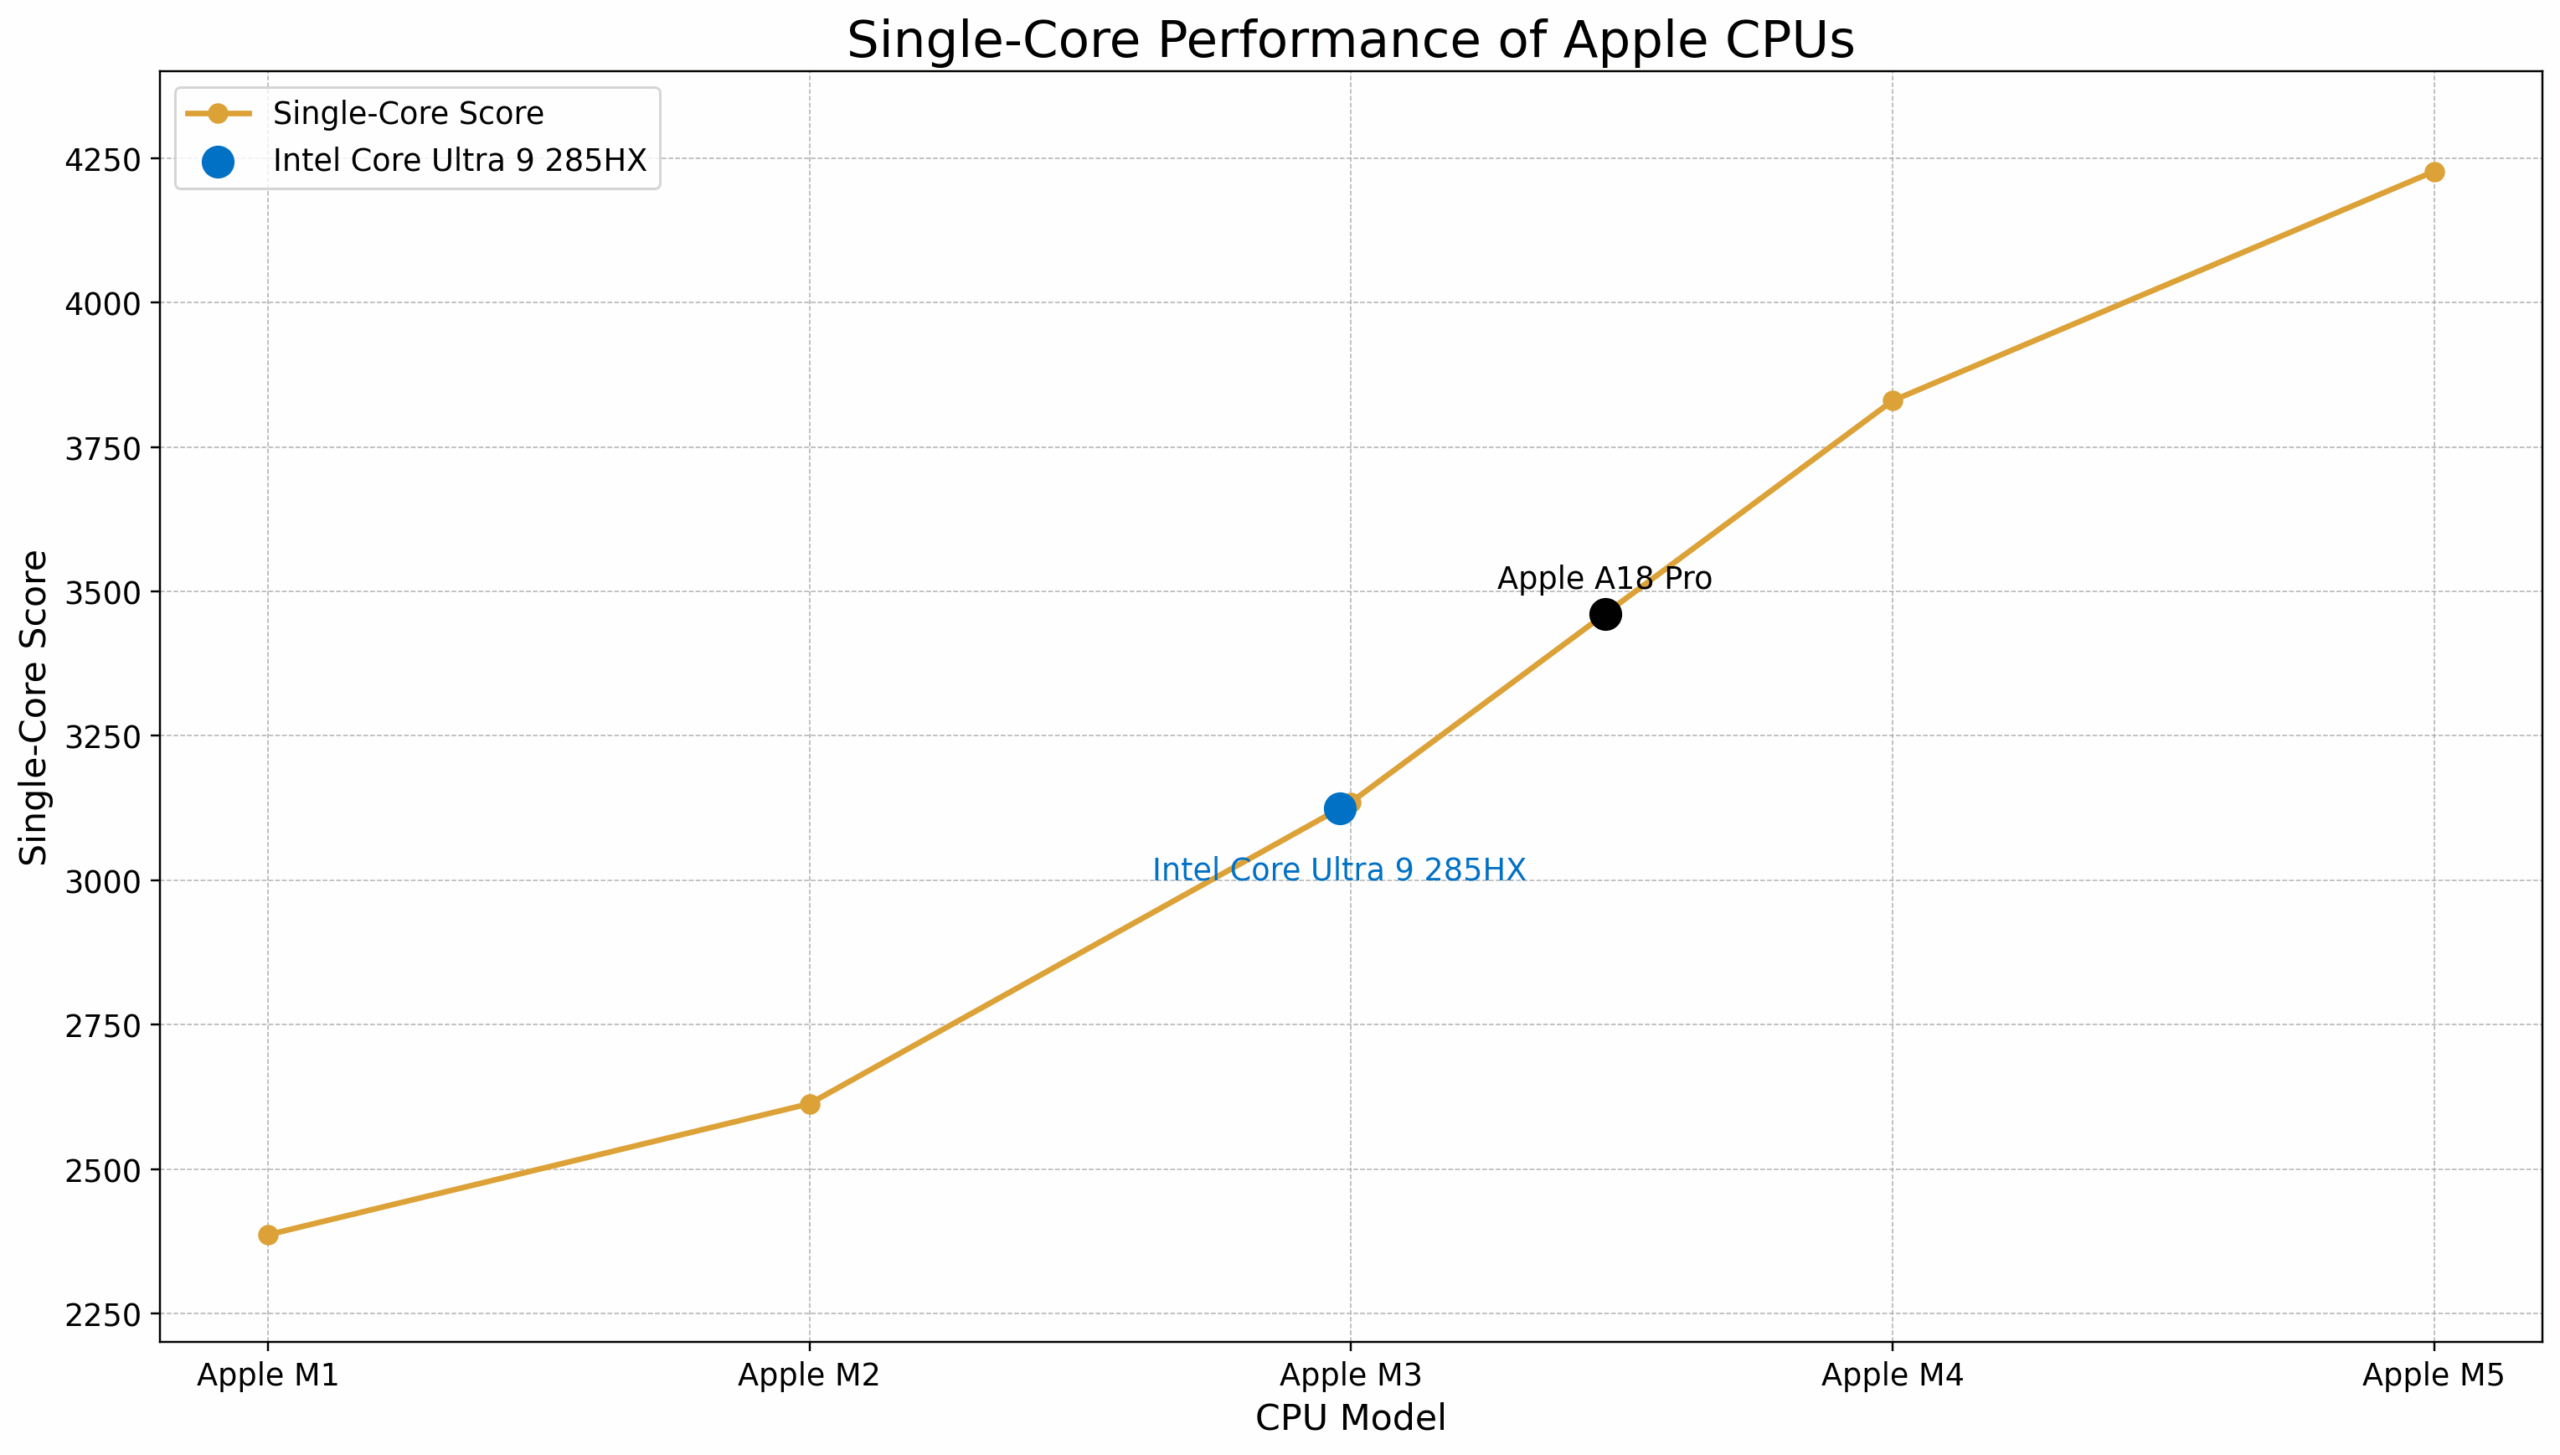
| CPU | Geekbench 6 Enkele kern | Prestatiesprong (%) |
| Apple M1 | 2386 | – |
| Apple M2 | 2613 | +10% |
| Apple M3 | 3135 | +20% |
| Apple A18 Pro (MacBook Neo) | 3461 | – |
| Apple M4 | 3830 | +22% |
| Apple M5 | 4227 | +10% |
| Gemiddelde prestatie sprong: +16% | ||
De Apple M4 vertegenwoordigt de grootste sprong tot nu toe in single-core prestaties.
Er zijn ook twee “getrimde” varianten van de M4: de 8-core Apple M4 die te vinden is in de meest budget iMac, en de 9-core Apple M4 die te vinden is in de meest budget iPad Pro:
| CPU | Geekbench 6 Single-Core | Prestatiesprong (%) |
| Apple M4 (8-core, iMac) | 3650 | |
| Apple M4 (9-core, iPad) | 3671 | +0.5% |
| Apple M4 (10-core, MacBook Pro) | 3830 | +4% |
Prestaties met meerdere cores
Multi-core prestaties zijn essentieel voor het uitvoeren van complexe en veeleisende taken, zoals videobewerking, 3D rendering en wetenschappelijke simulaties.
De tabel hieronder geeft een overzicht van de multikernprestaties van de CPU’s uit de basismodellen van de M-serie van Apple, waarbij de scoreverbeteringen en prestatieverbeteringen van elke nieuwe generatie naar voren komen. Voor de context hebben we de best presterende Intel-chip in onze Top Laptop CPU Ranking toegevoegd, de Intel Core Ultra 9 285HX, die 22215 punten scoort.
De Apple A18 Pro in de MacBook Neo staat net boven de Apple M1-chip.
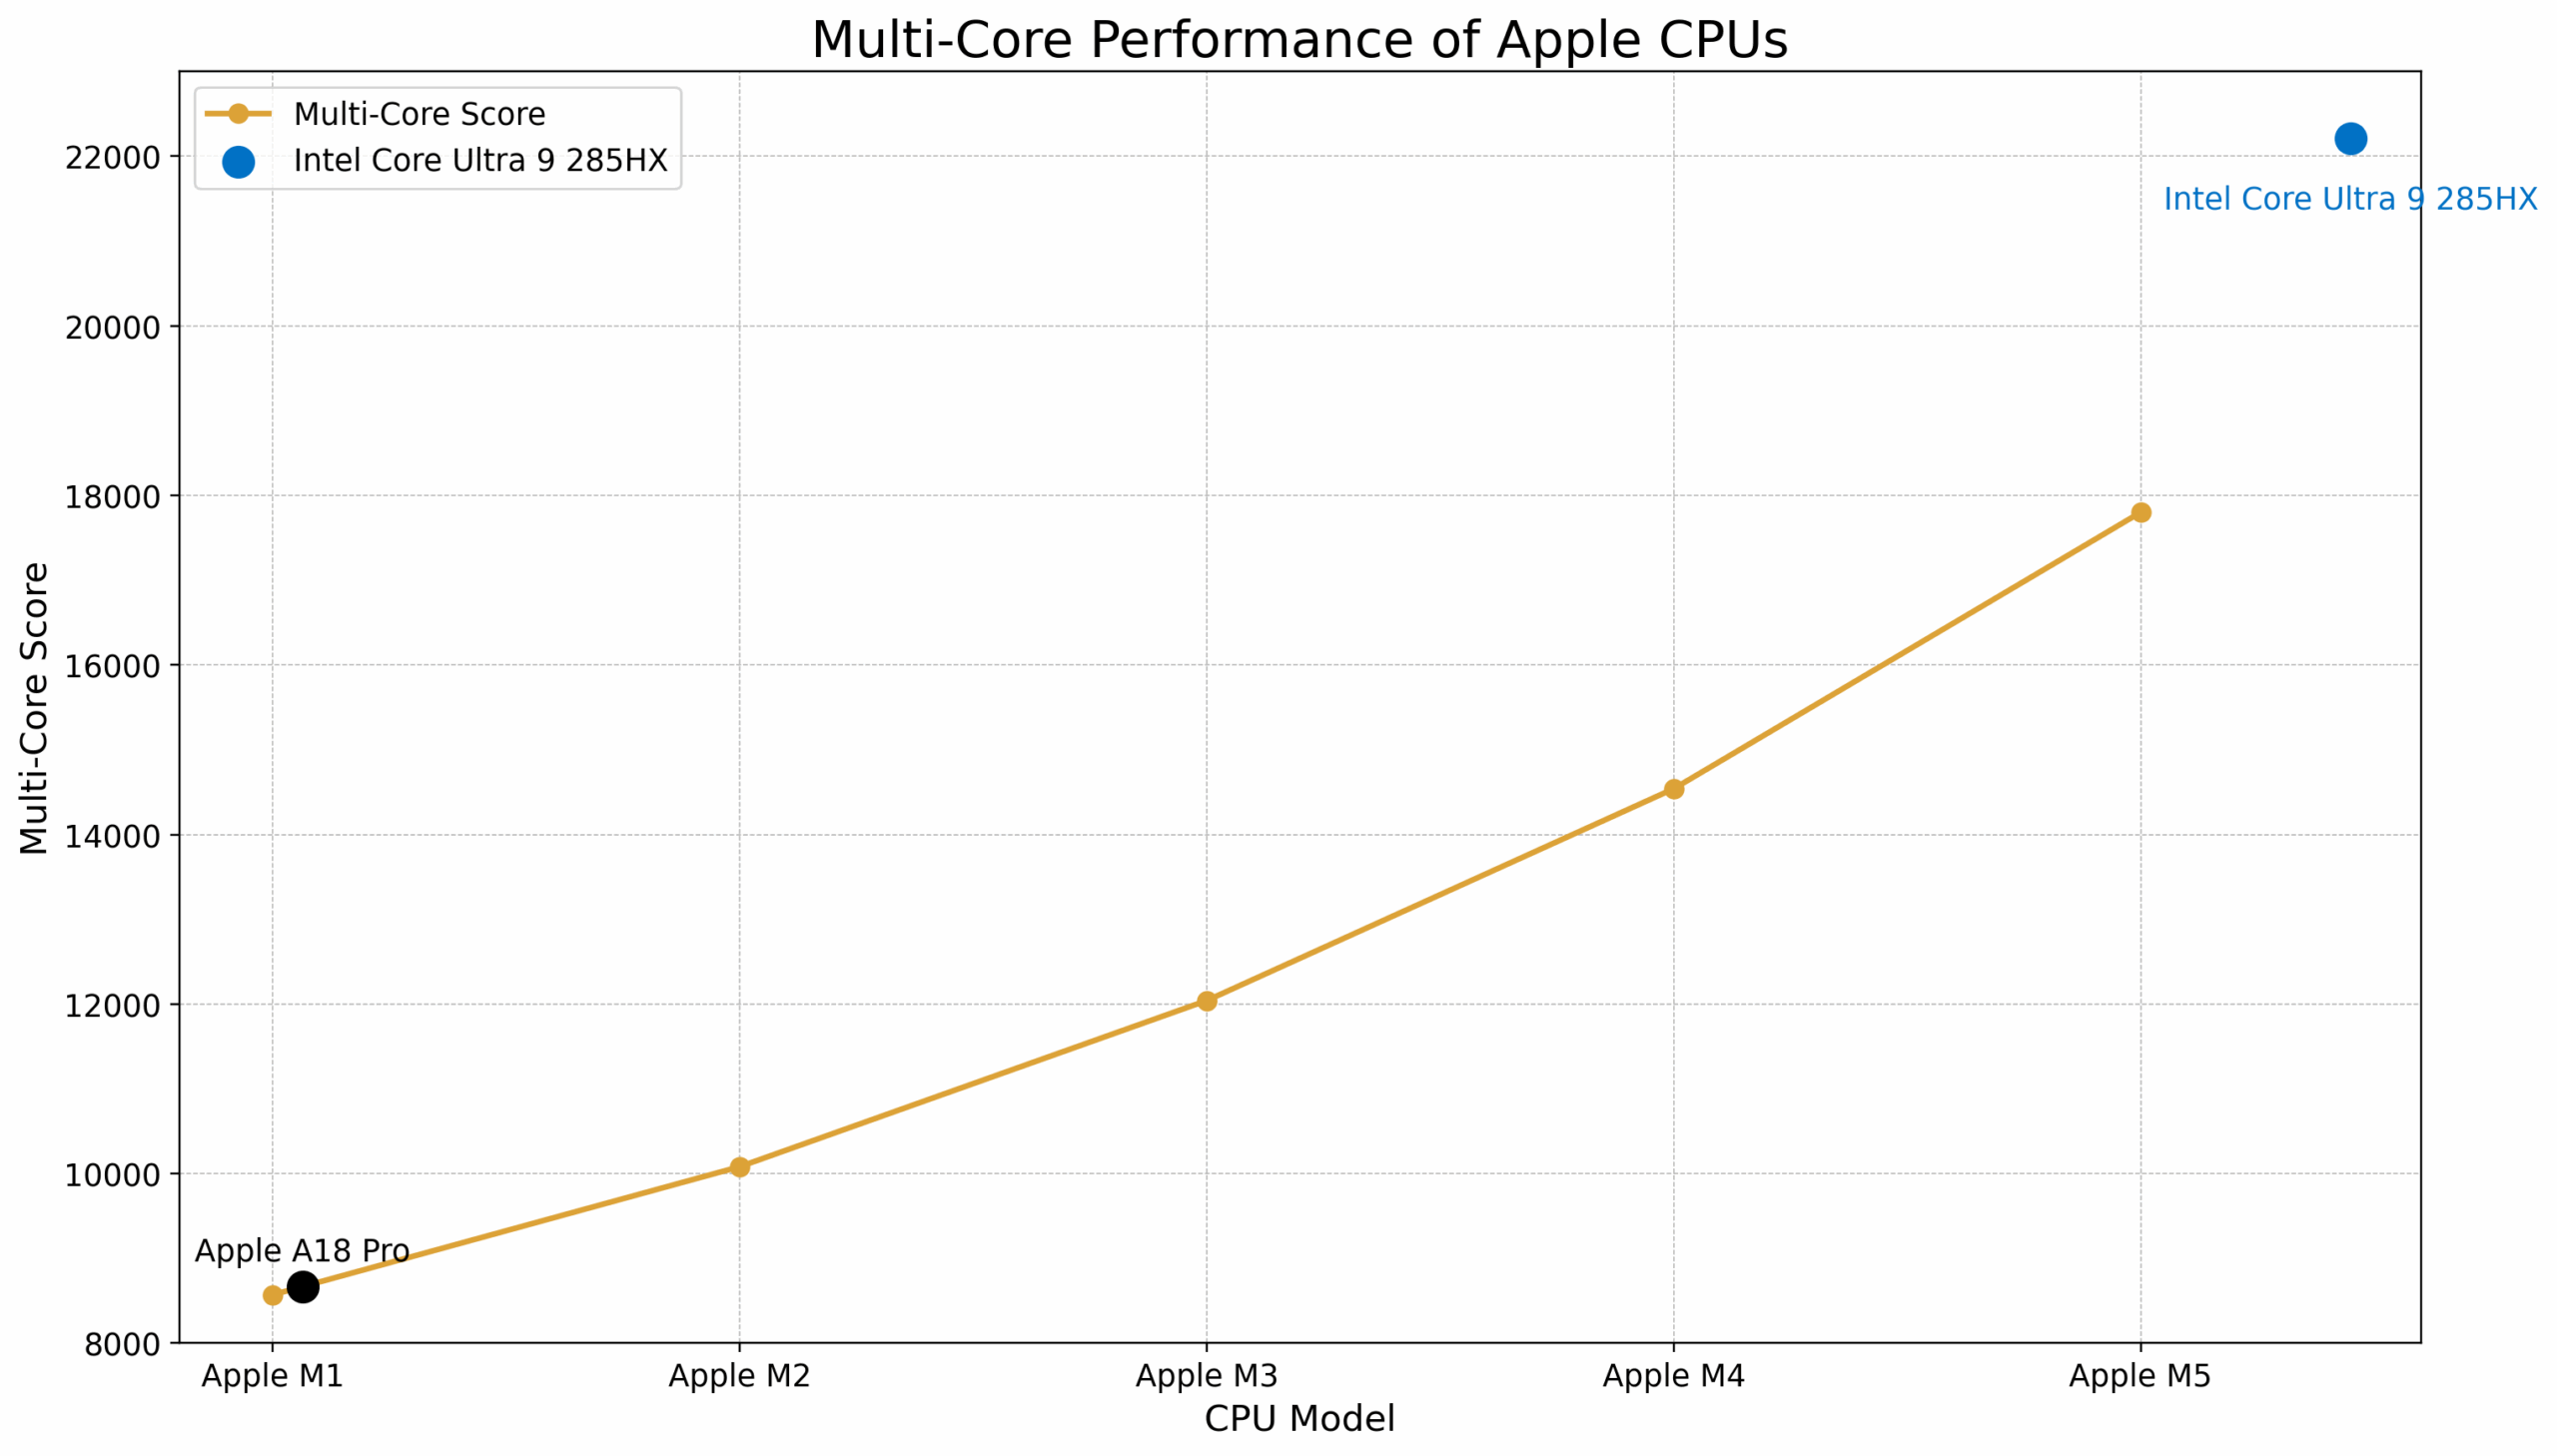
| CPU | Geekbench 6 Multi-Core | Prestatiesprong (%) |
| Apple M1 | 8571 | – |
| Apple A18 Pro (MacBook Neo) | 8668 | – |
| Apple M2 | 10082 | +18% |
| Apple M3 | 12042 | +19% |
| Apple M4 | 14541 | +21% |
| Apple M5 | 17802 | +22% |
| Gemiddelde prestatie sprong: +20% | ||
Multi-core prestaties volgen de single-core verbeteringen op de voet, waarbij de nieuwste M5 de meest substantiële vooruitgang laat zien. De basisvarianten blijven echter nog steeds achter bij het vlaggenschip van Intel, de Core Ultra 9 285HX, voor complexe taken.
Nogmaals, hier is een vergelijking van M4-varianten:
| CPU | Prestaties kernen | Geekbench 6 Multi-Core | Prestatiesprong (%) |
| Apple M4 (9-core, iPad) | 3 | 13 381 | |
| Apple M4 (8-core, iMac) | 4 | 13 836 | +3% |
| Apple M4 (10-core, MacBook Pro) | 4 | 14 990 | +8% |
Laten we dit eens vergelijken met de Pro, Max en Ultra varianten van de Apple M-serie.
Apple M1 Pro vs M2 Pro vs M3 Pro vs M4 Pro vs M5 Pro
De 14-core M4 Pro heeft 10 prestatiecores die een waanzinnige prestatiewinst van 45% opleveren! Dit is 3% hoger dan Intels mobiele vlaggenschip , de Intel Core Ultra 9 285HX. Dus eigenlijk is de Ultra 9 285HX ongeveer net zo snel als de Apple M3 in single-core en als de Apple M4 Pro in multi-core.
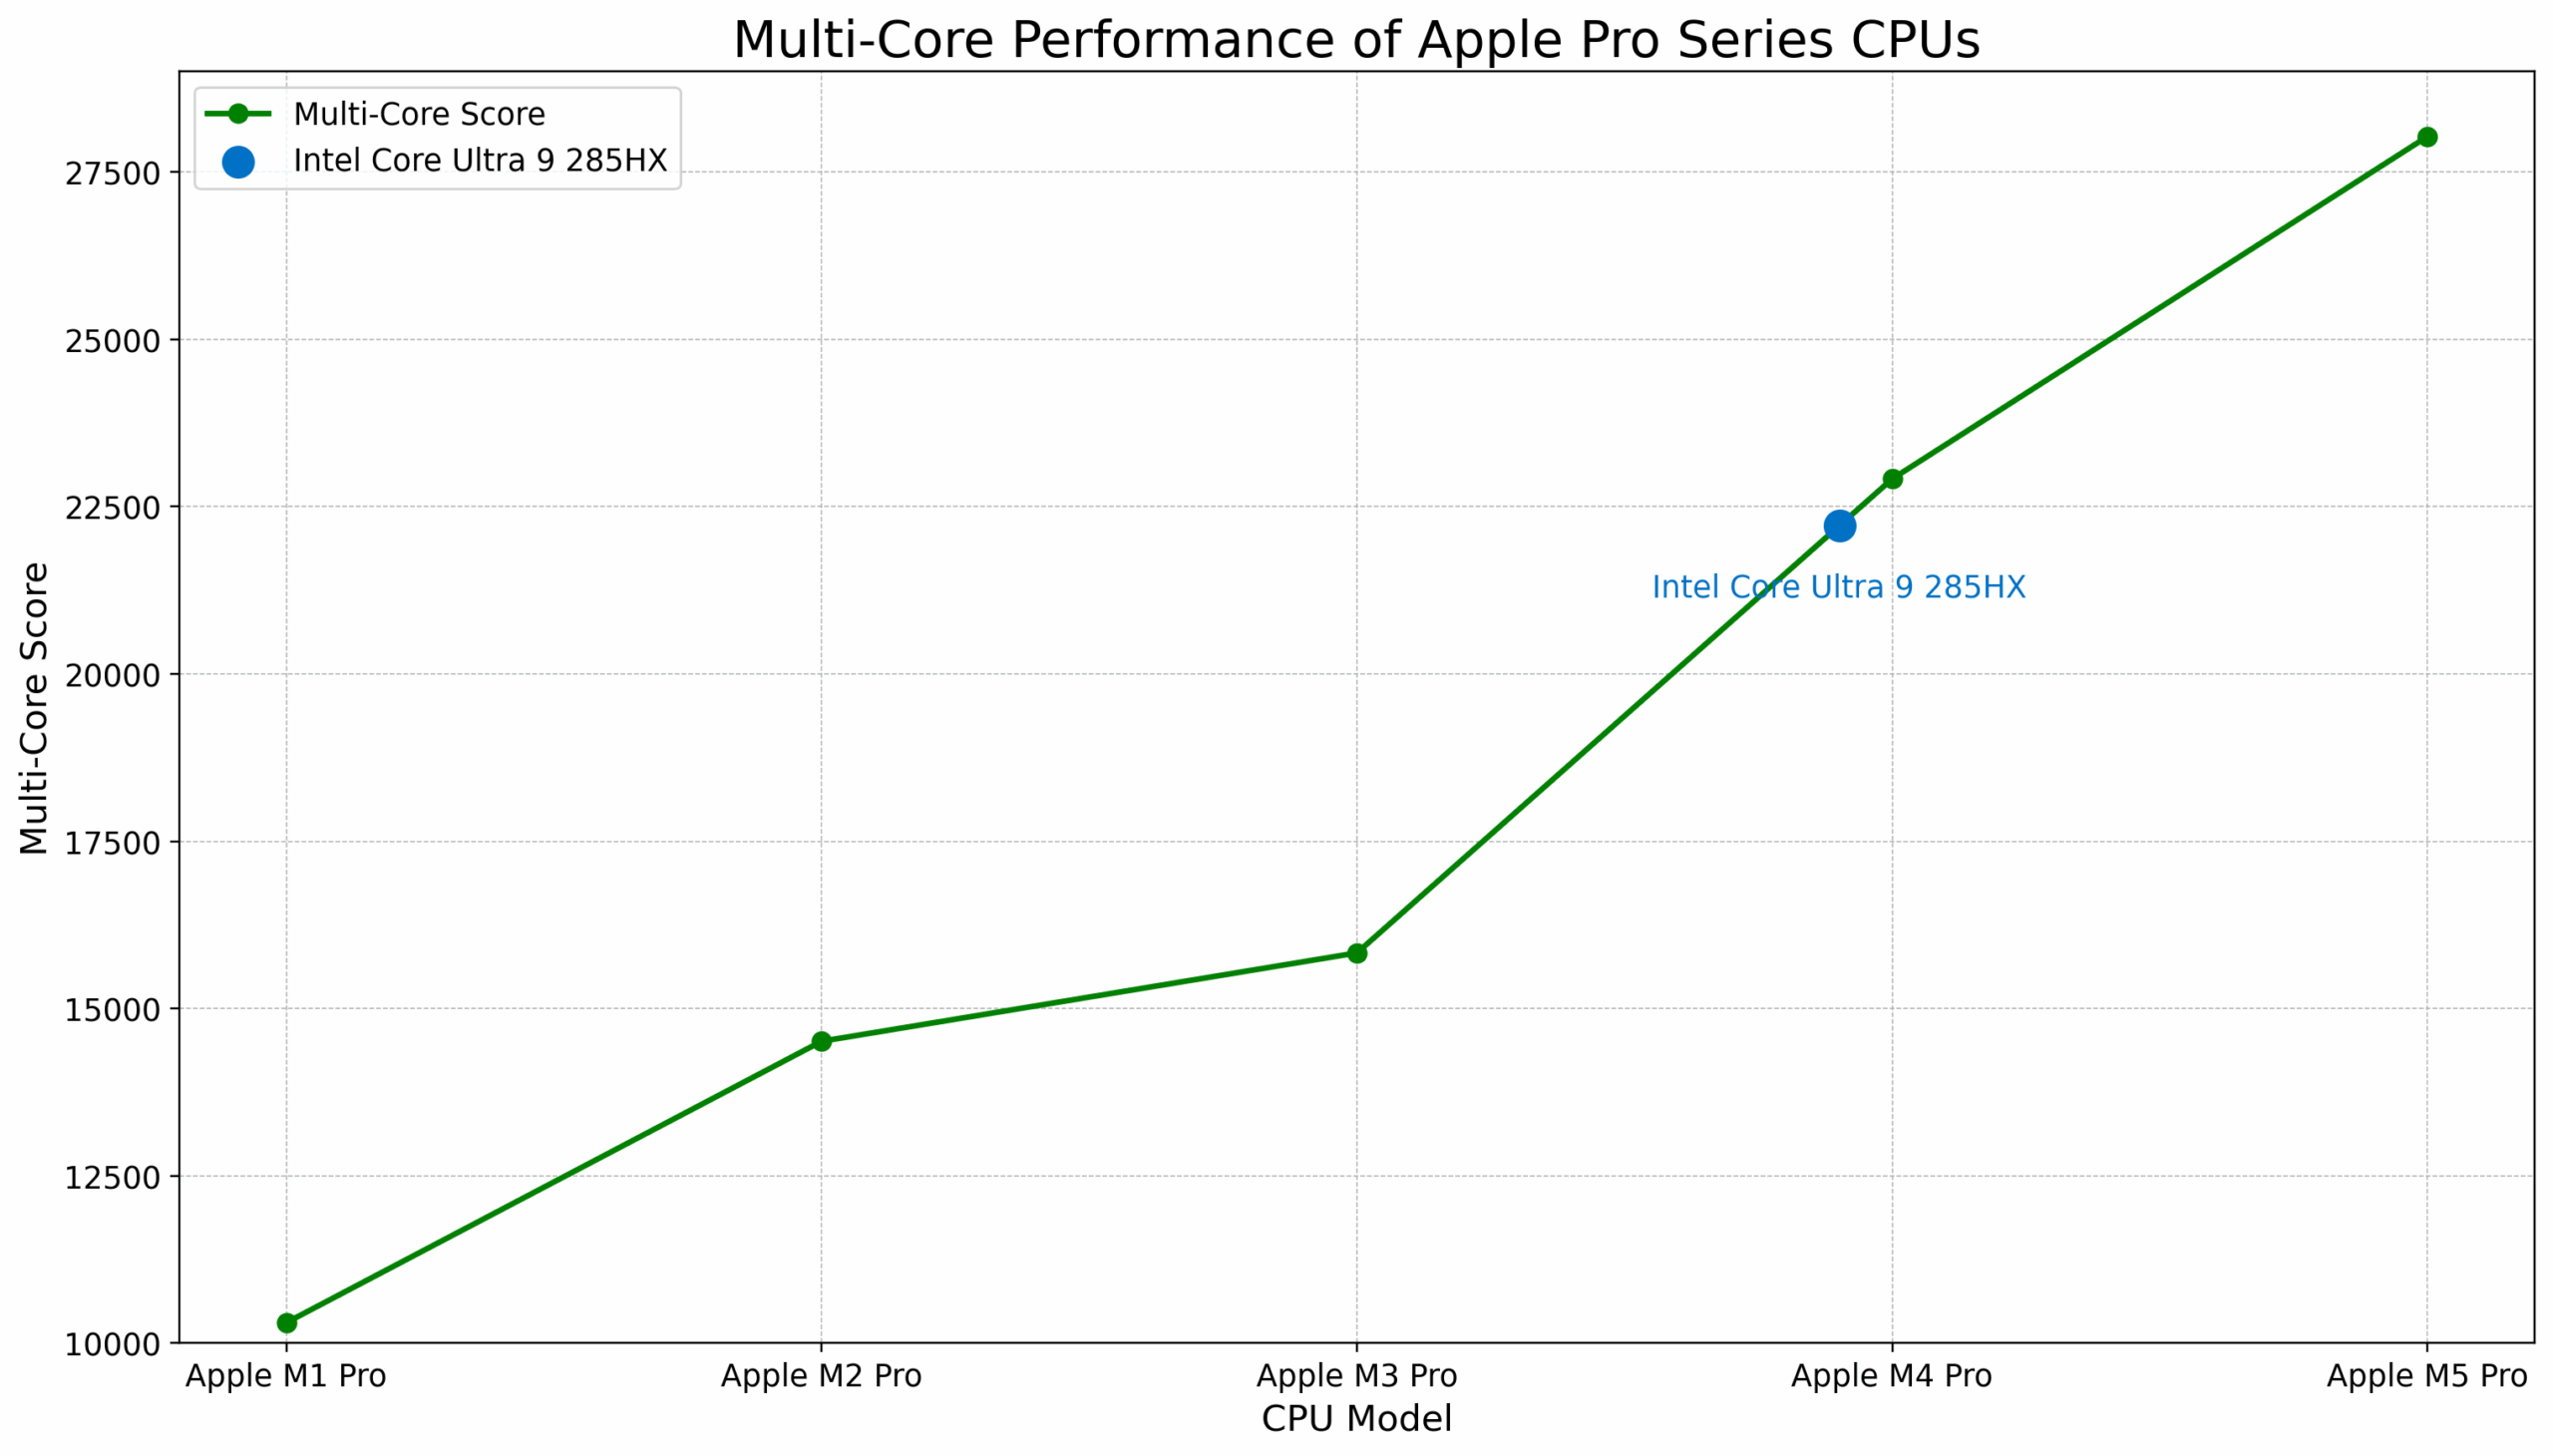
| CPU | Geekbench 6 Multi-Core | Prestatiesprong (%) |
| Apple M1 Pro (8-core CPU) | 10 307 | |
| Apple M2 Pro (12-core CPU) | 14 511 | +41% |
| Apple M3 Pro (12-core CPU) | 15 831 | +9% |
| Apple M4 Pro (CPU met 14 cores) | 22 914 | +45% |
| Apple M5 Pro (CPU met 18 cores) | 28030 | +22% |
| Gemiddelde prestatiesprong: 29% | ||
Apple M1 Max vs M2 Max vs M3 Max vs M4 Max vs M5 Max
M3 Max was de enige Apple processor die beter presteerde dan Intels toenmalige vlaggenschip i9-14900HX bij het vergelijken van mobiele processors. Nu is het blauwe vlaggenschip de Intel Core Ultra 9 285HX, en het multi-core resultaat ligt net tussen de M3 Max en M4 Max in.
M5 Max scoort op 29 159 punten, 31% boven 285HX:
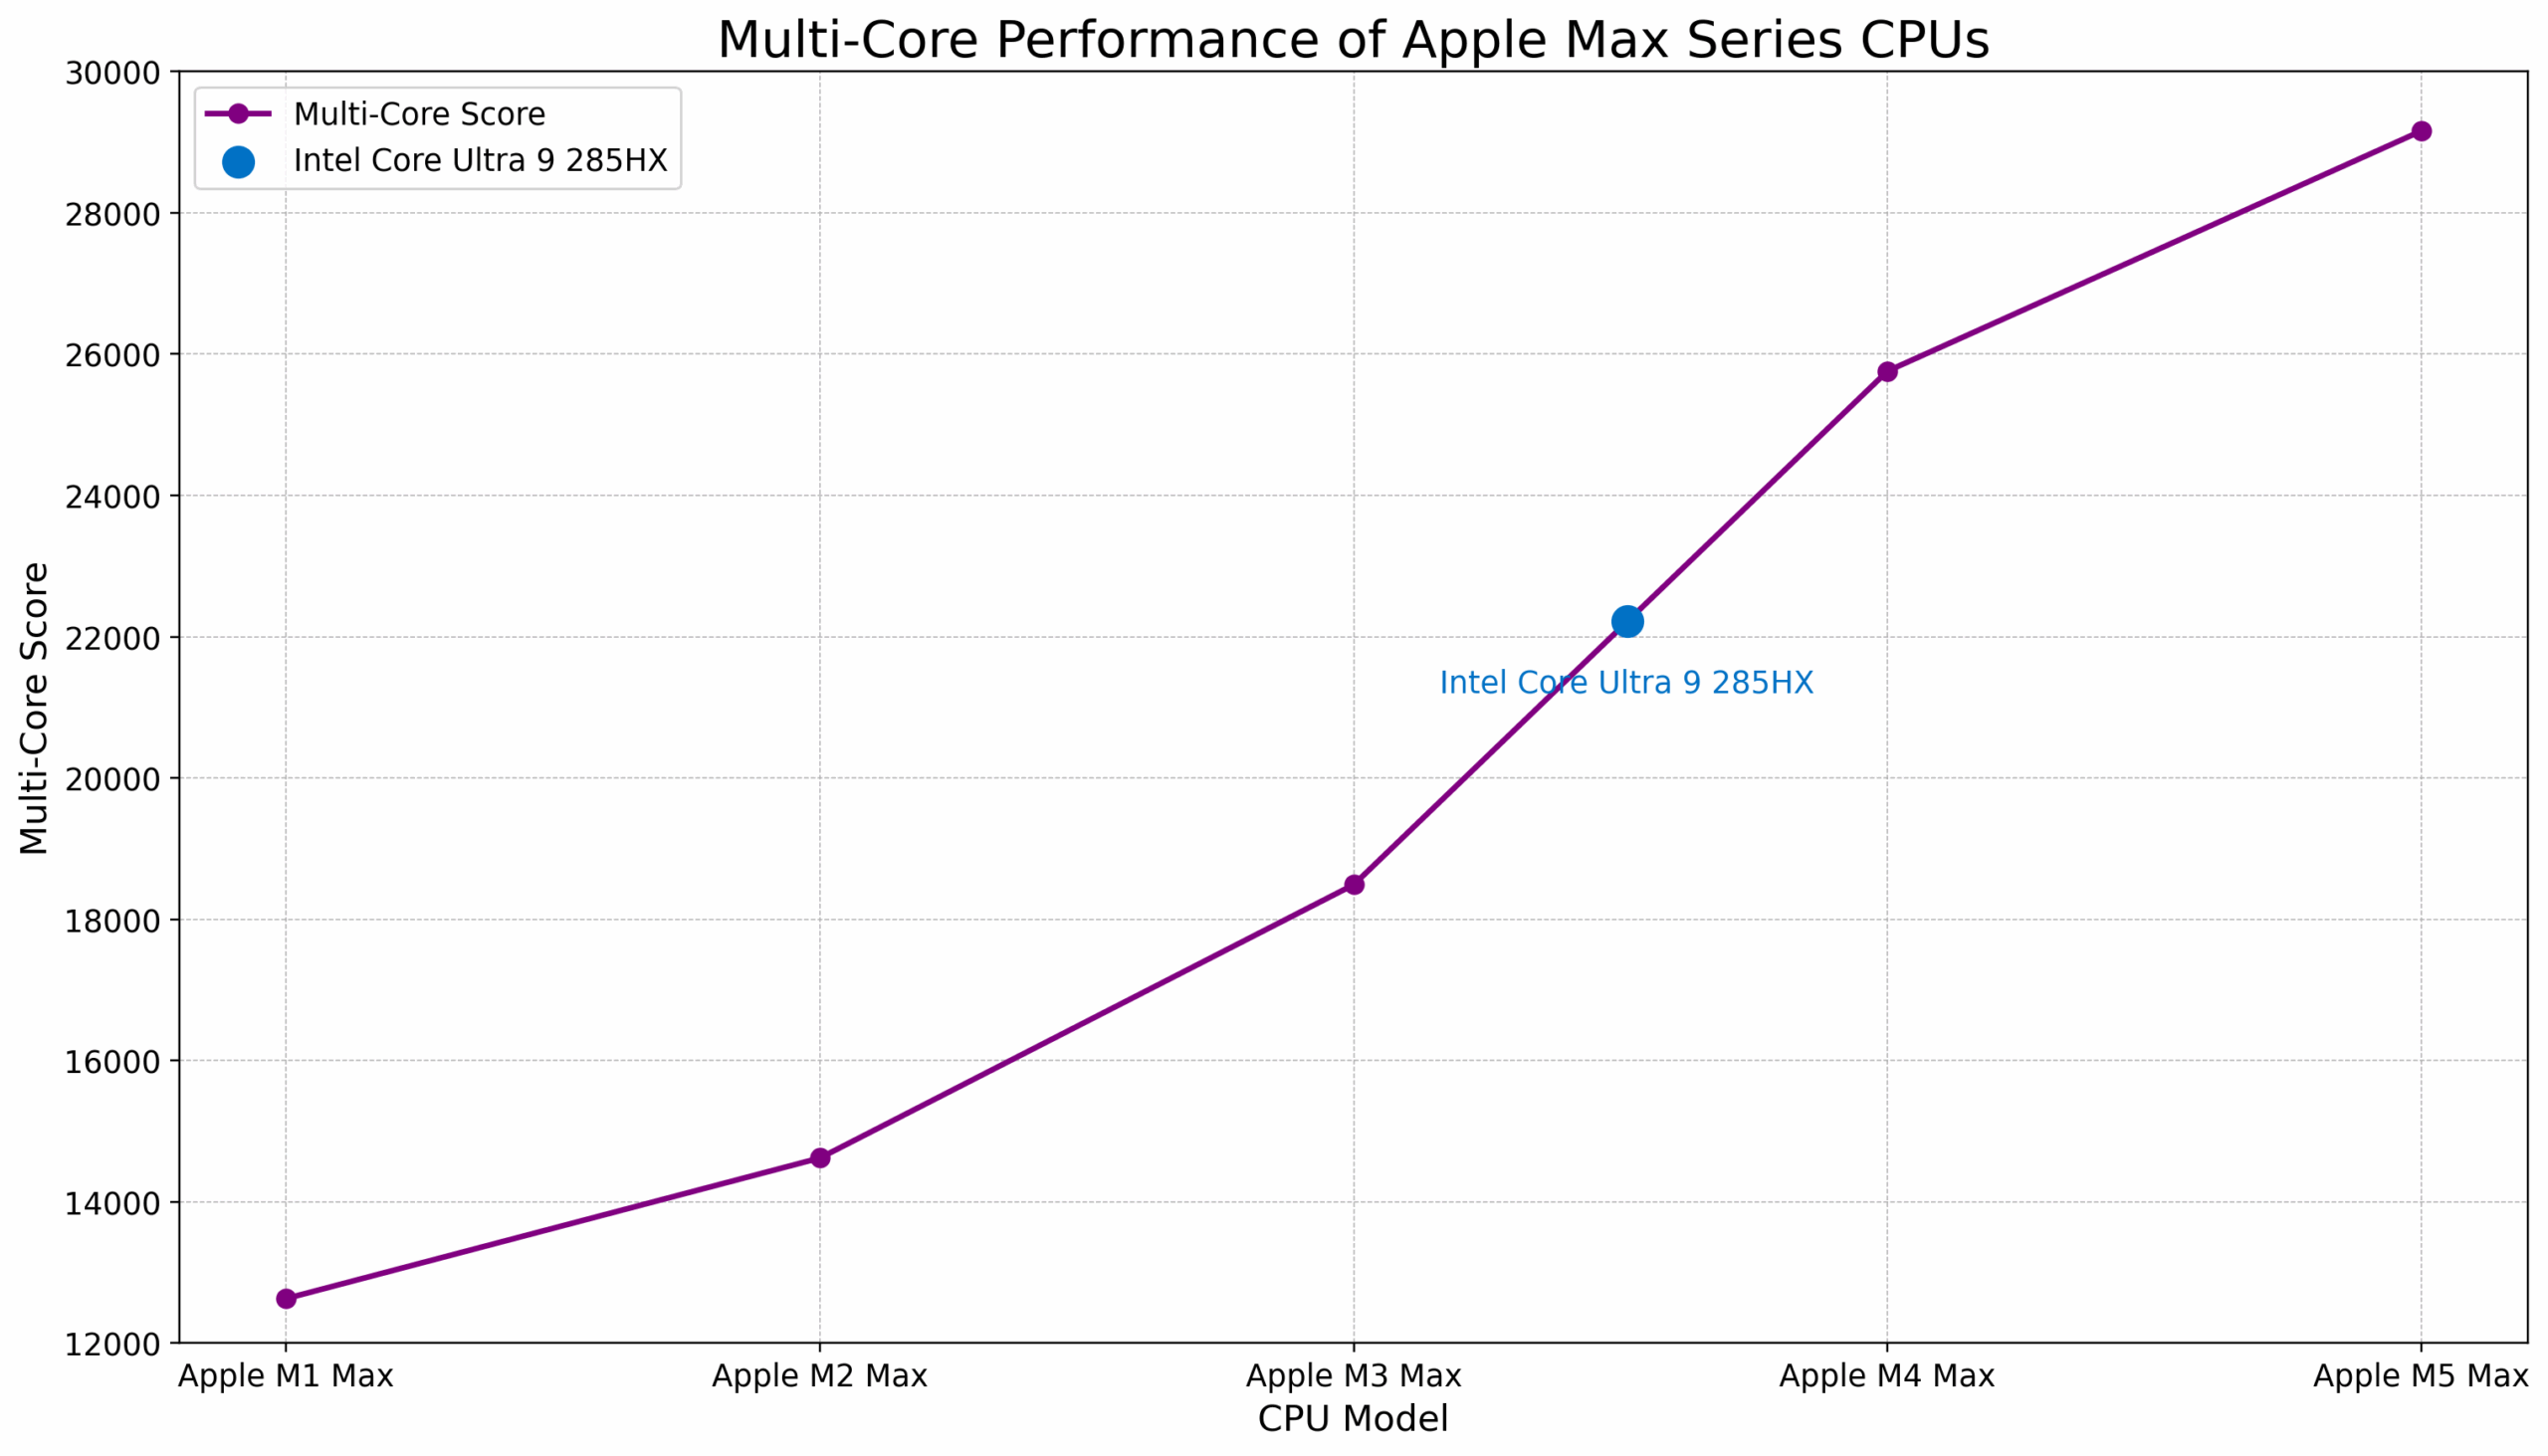
| CPU | Geekbench 6 Multi-Core | Prestatiesprong (%) |
| Apple M1 Max (10-core CPU) | 12 631 | |
| Apple M2 Max (12-core CPU) | 14 621 | +16% |
| Apple M3 Max (CPU met 14 cores) | 18 490 | +26% |
| Apple M4 Max (16-core CPU) | 25 760 | +39% |
| Apple M5 Max (CPU met 18 cores) | 29 159 | +13% |
| Gemiddelde prestatiesprong: 24% | ||
Apple M1 Ultra vs M2 Ultra vs M3 Ultra vs M4 Ultra en M5 Ultra (verwacht)
Edit [03/2025]: Apple M3 Ultra werd veel later uitgebracht dan verwacht, maar hij is er nu, en het is een enorme update – 33% prestatiewinst! Dit verandert de prognose voor M4 Ultra van 33 773 punten naar 37 867 punten, en de prognose voor M5 Ultra klimt naar een waanzinnige 42 864 punten!
Aangezien Ultra-chips meestal worden gebruikt in desktopconfiguraties, wisselen we de mobiele Intel Core Ultra 9 285HX om met het desktopvlaggenschip Intel Core Ultra 9 285K, die 22.000 punten scoort in de Multi-Core test en 4% sneller is dan de M2 Ultra.
Hierdoor zal de M4 Ultra naar verwachting 72% sneller zijn dan de Intel Core Ultra 9 285K en de M5 Ultra zou twee keer zo snel kunnen zijn als de Intel Core Ultra 9 285K. Natuurlijk is dit slechts een prognose en zou Apple waarschijnlijk de Mac Studio opnieuw moeten ontwerpen om er een M4 Ultra of M5 Ultra in te kunnen plaatsen.
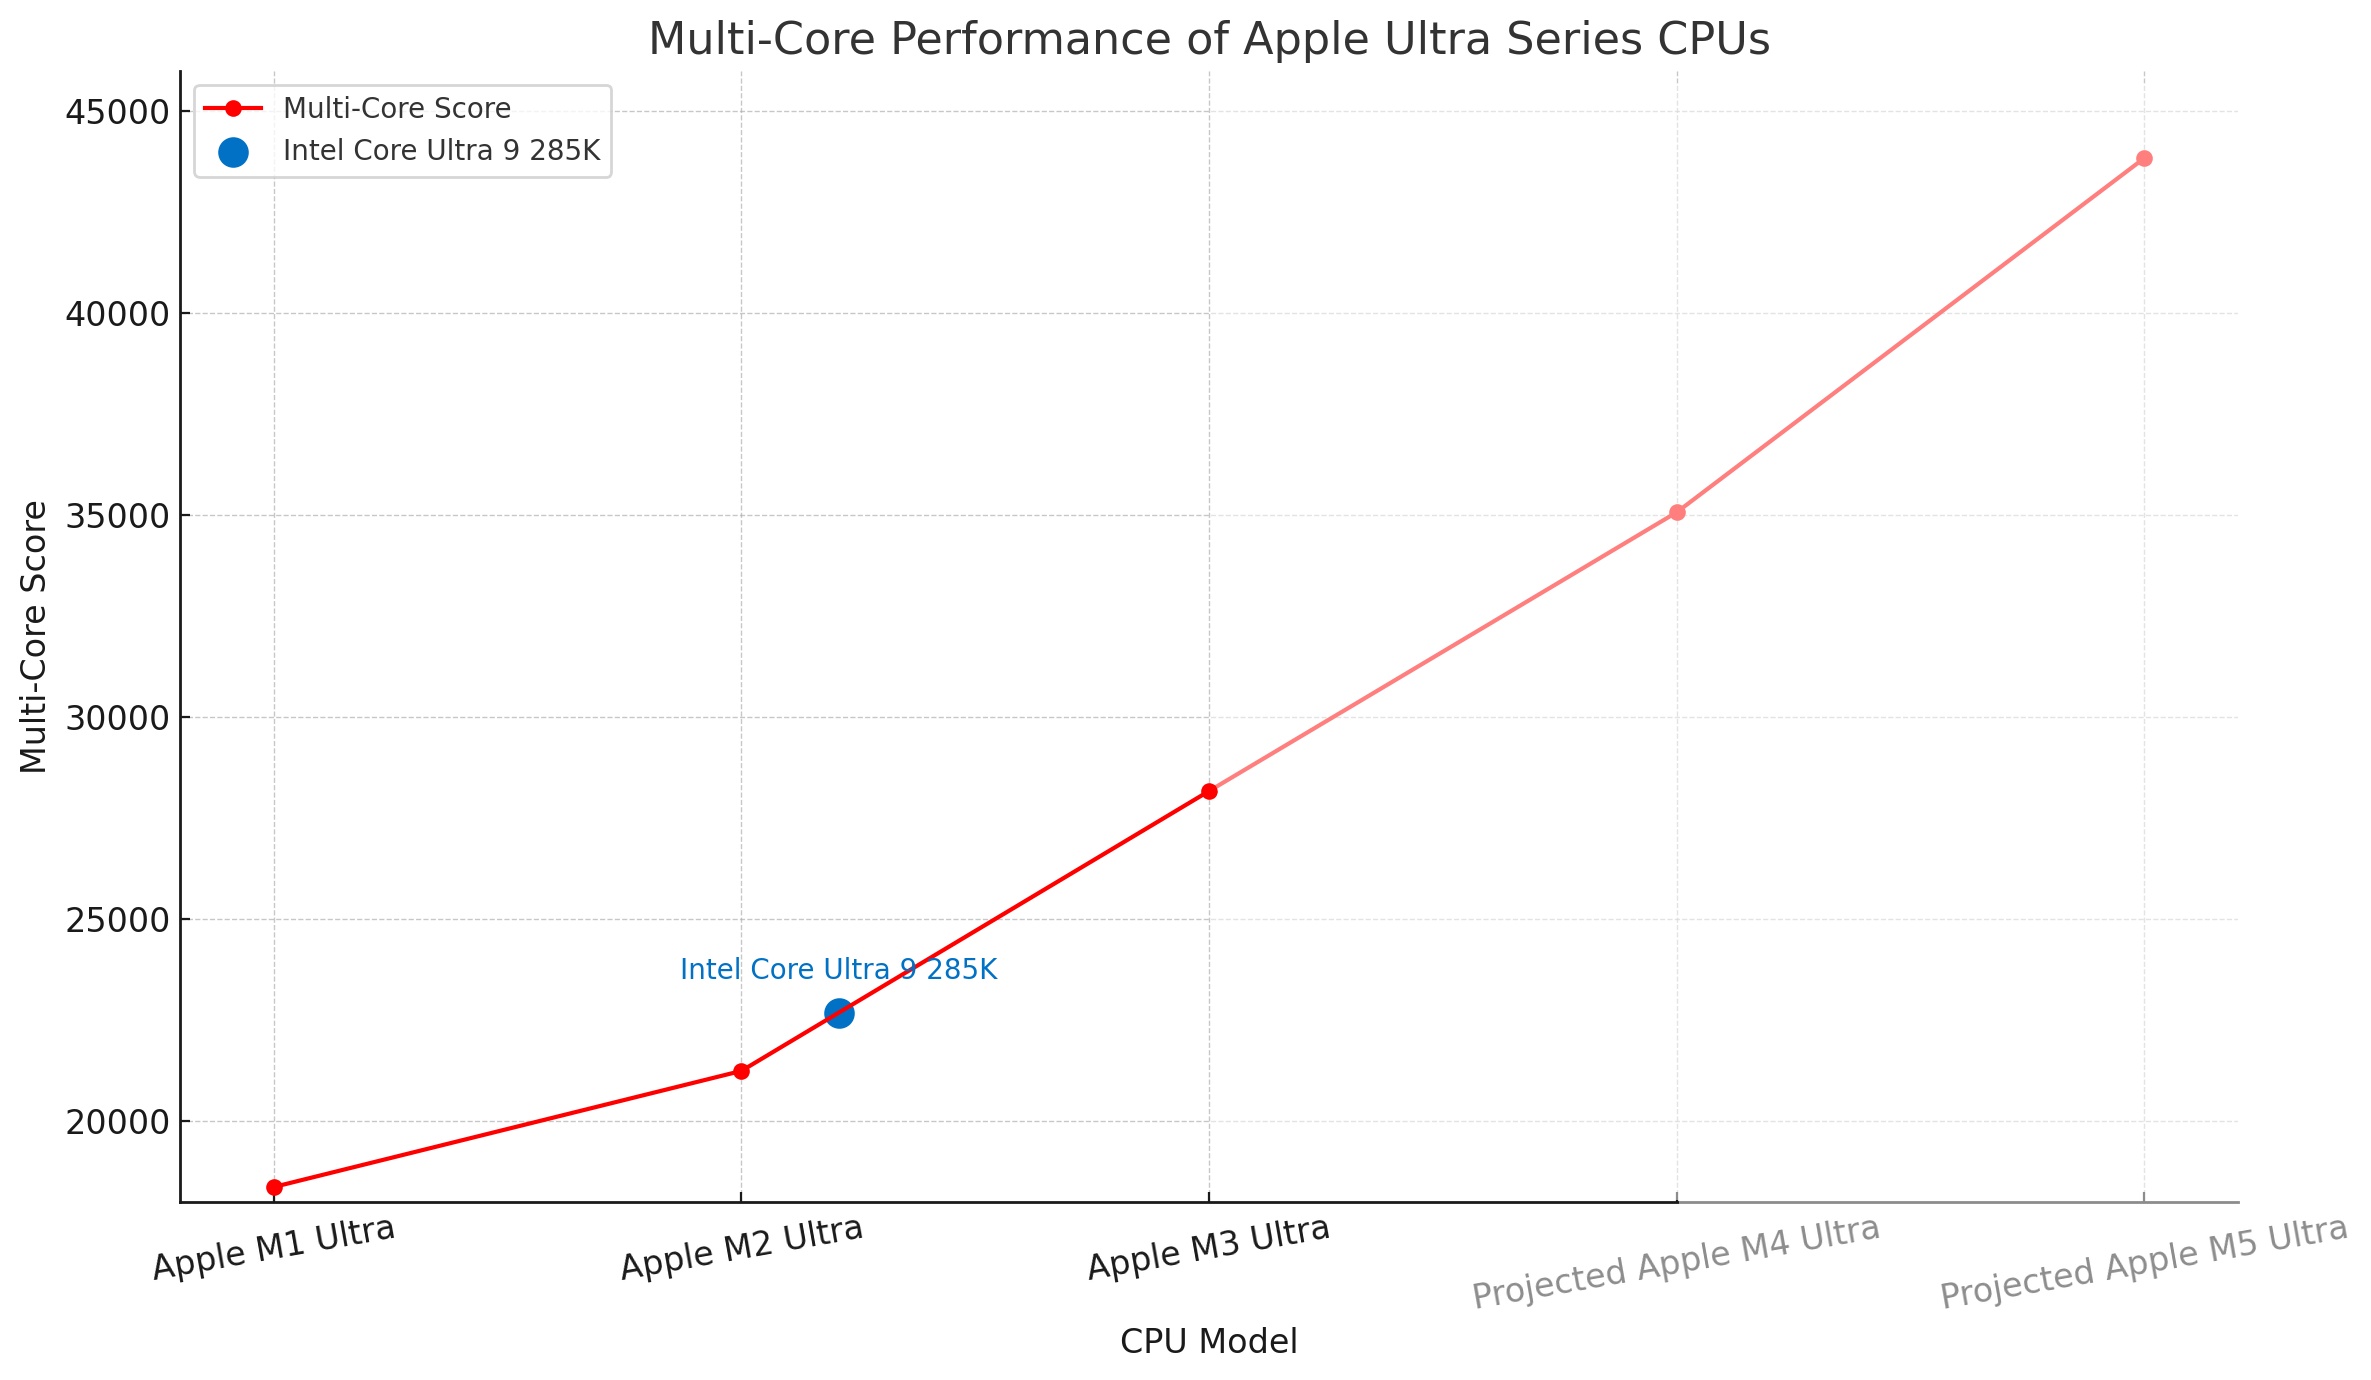
| CPU | Geekbench 6 Multi-Core | Prestatiesprong (%) |
| Apple M1 Ultra | 18 367 | |
| Apple M2 Ultra | 21 241 | +16% |
| Apple M3 Ultra | 28 169 | +33% |
| Verwachte Apple M4 Ultra | 37 867 | +34% |
| Verwachte Apple M5 Ultra | 42 864 | +13% |
| Gemiddelde prestatiesprong: 25% | ||
De ultieme vergelijking:
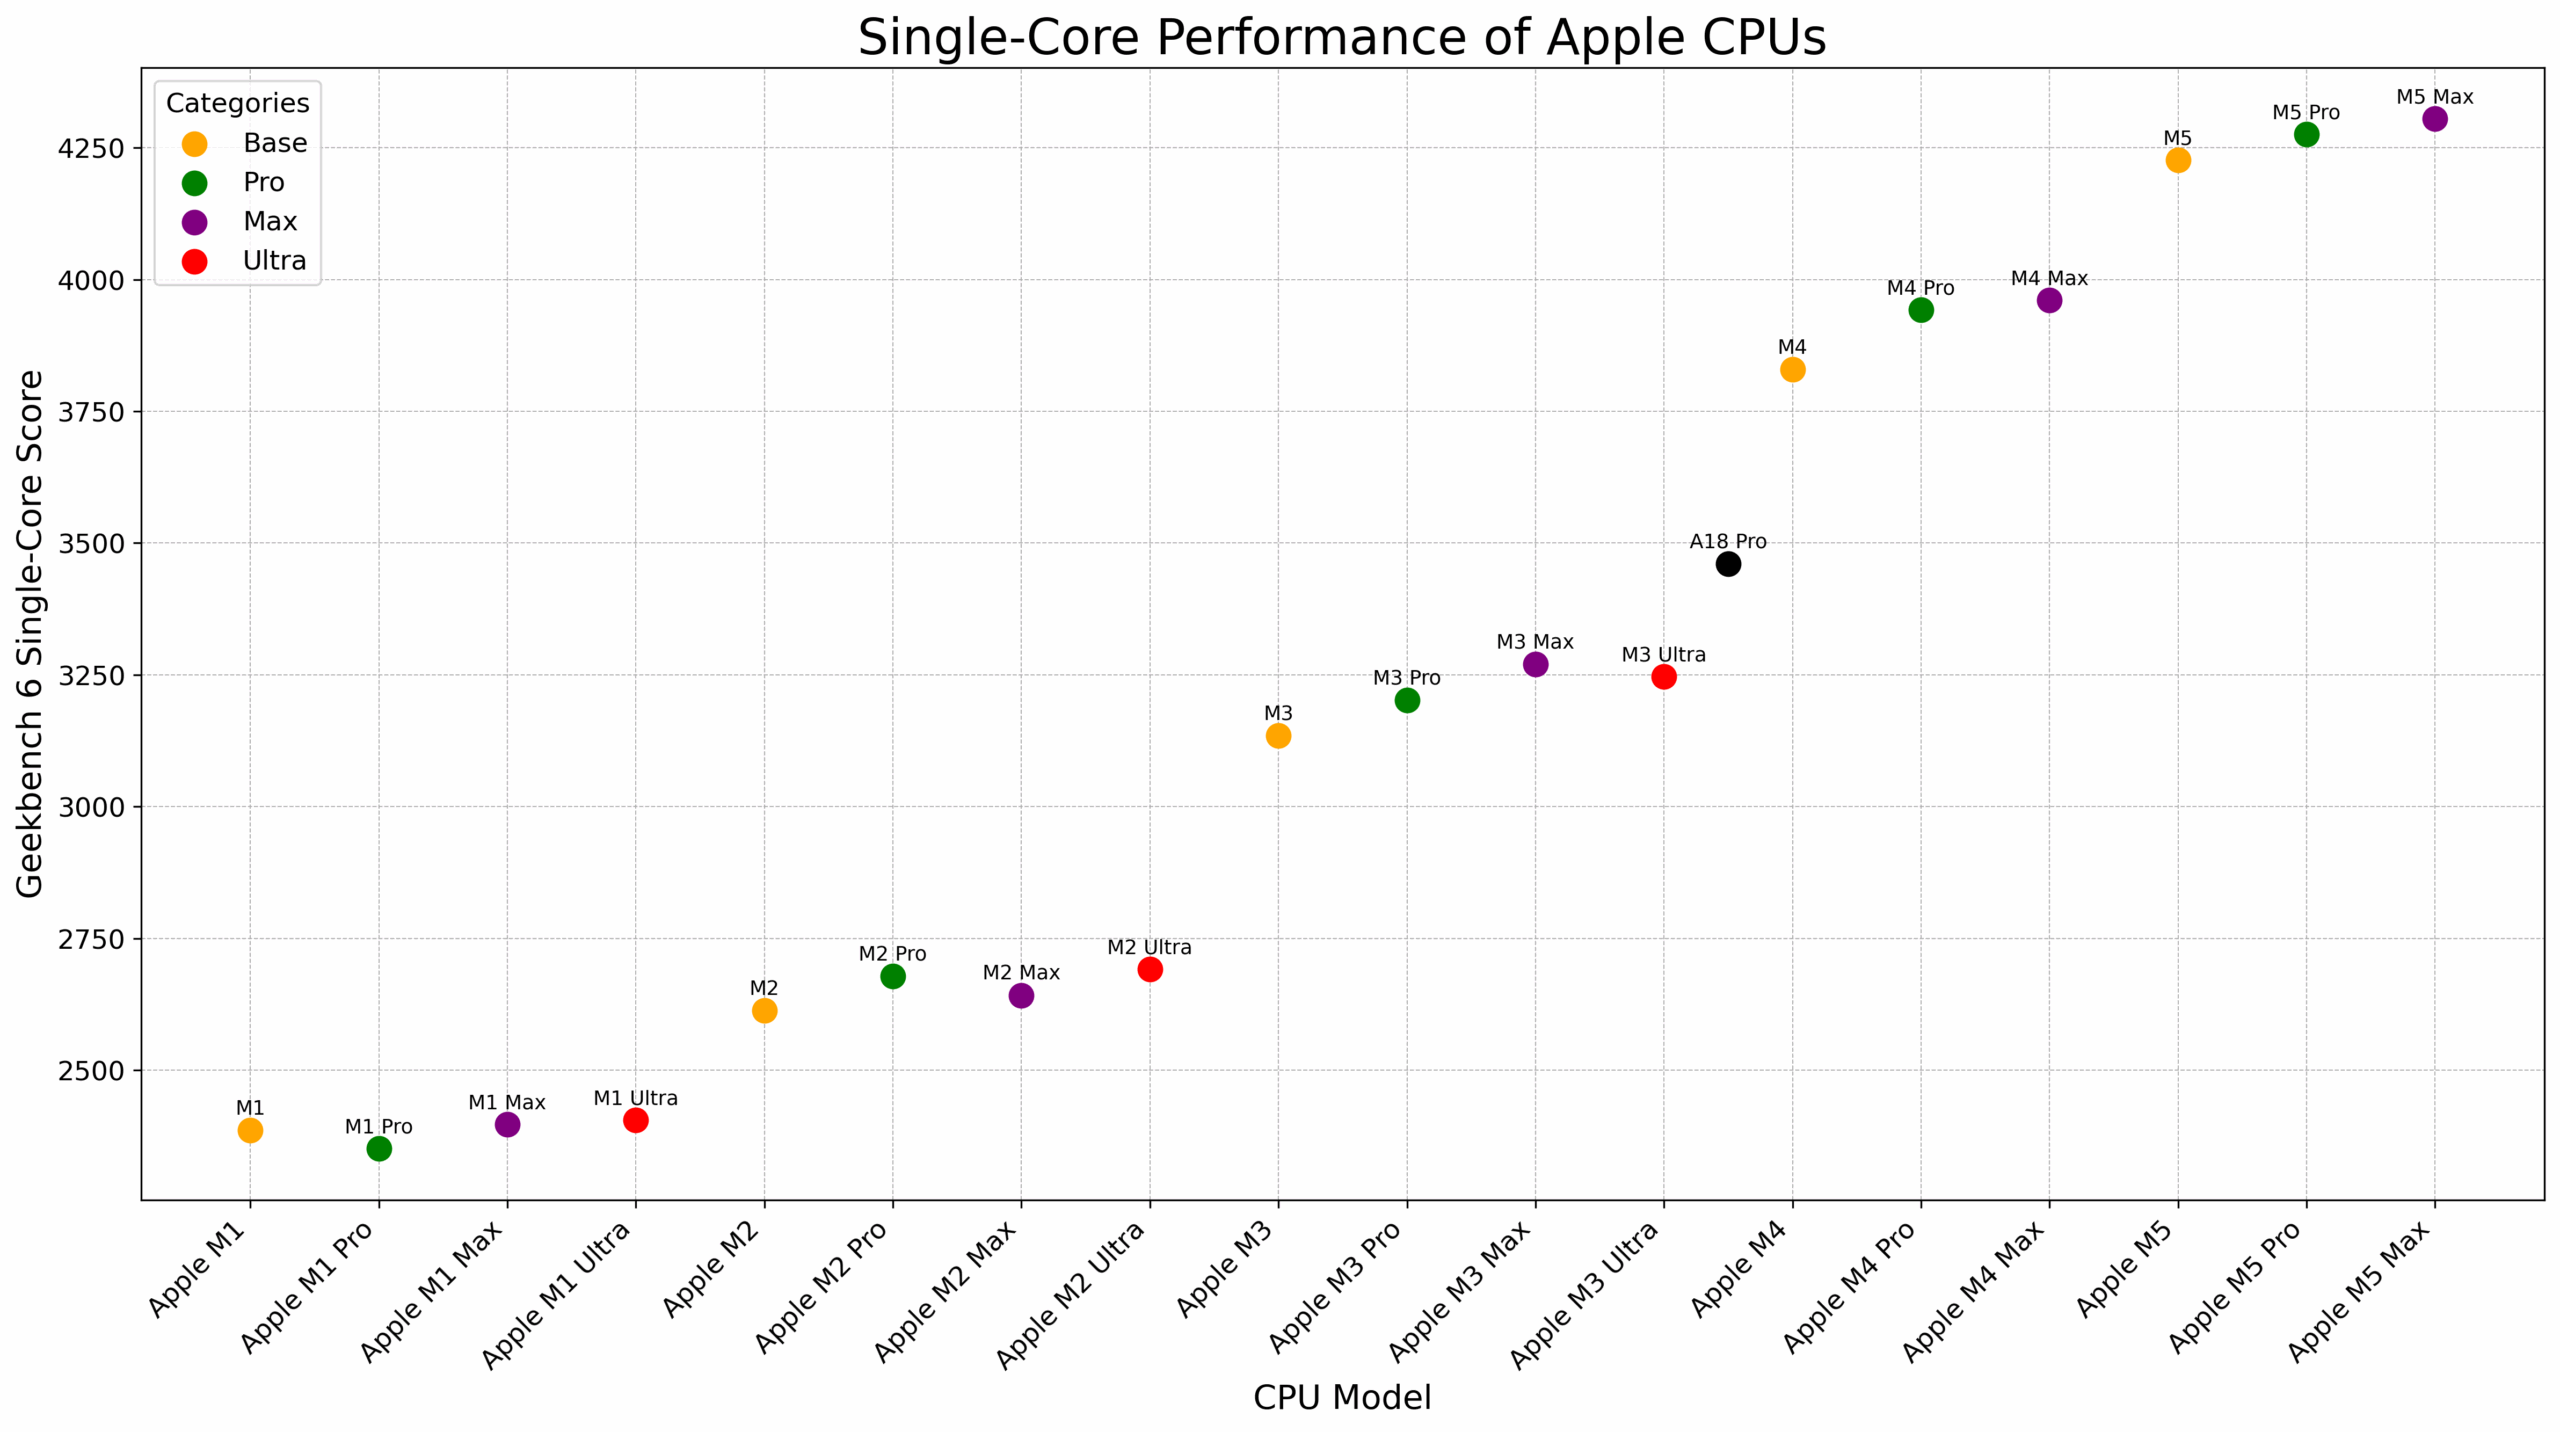
Laten we nu alle CPU’s uit de Apple M-serie eens grondig vergelijken aan de hand van actuele gegevens.
De nieuwste Apple M5 processor is de snelste CPU in termen van single-core kracht:
Als het op zwaar werk aankomt, is de multi-core prestatie van de Apple M5 vergelijkbaar met die van de kleinere variant van de M3 Max (14-core) en ligt deze 14% onder die van de M4 Pro (12-core). De M4 Max variant heeft echter een buitengewone geheugenbandbreedte (409,6 GB/s), die 3-4x zo groot is als die van de M4 (120 GB/s) en 2x zo groot als die van de M2 Pro (204,8 GB/s), wat gunstig is voor AI-projecten. De koning voor AI is de Apple M3 Ultra met 28.000+ multi-core score en 819,3 GB/s geheugenbandbreedte.
De M5 Pro variant evenaart de multi-core prestaties van de M3 Ultra, en de M5 Max is zelfs nog krachtiger:
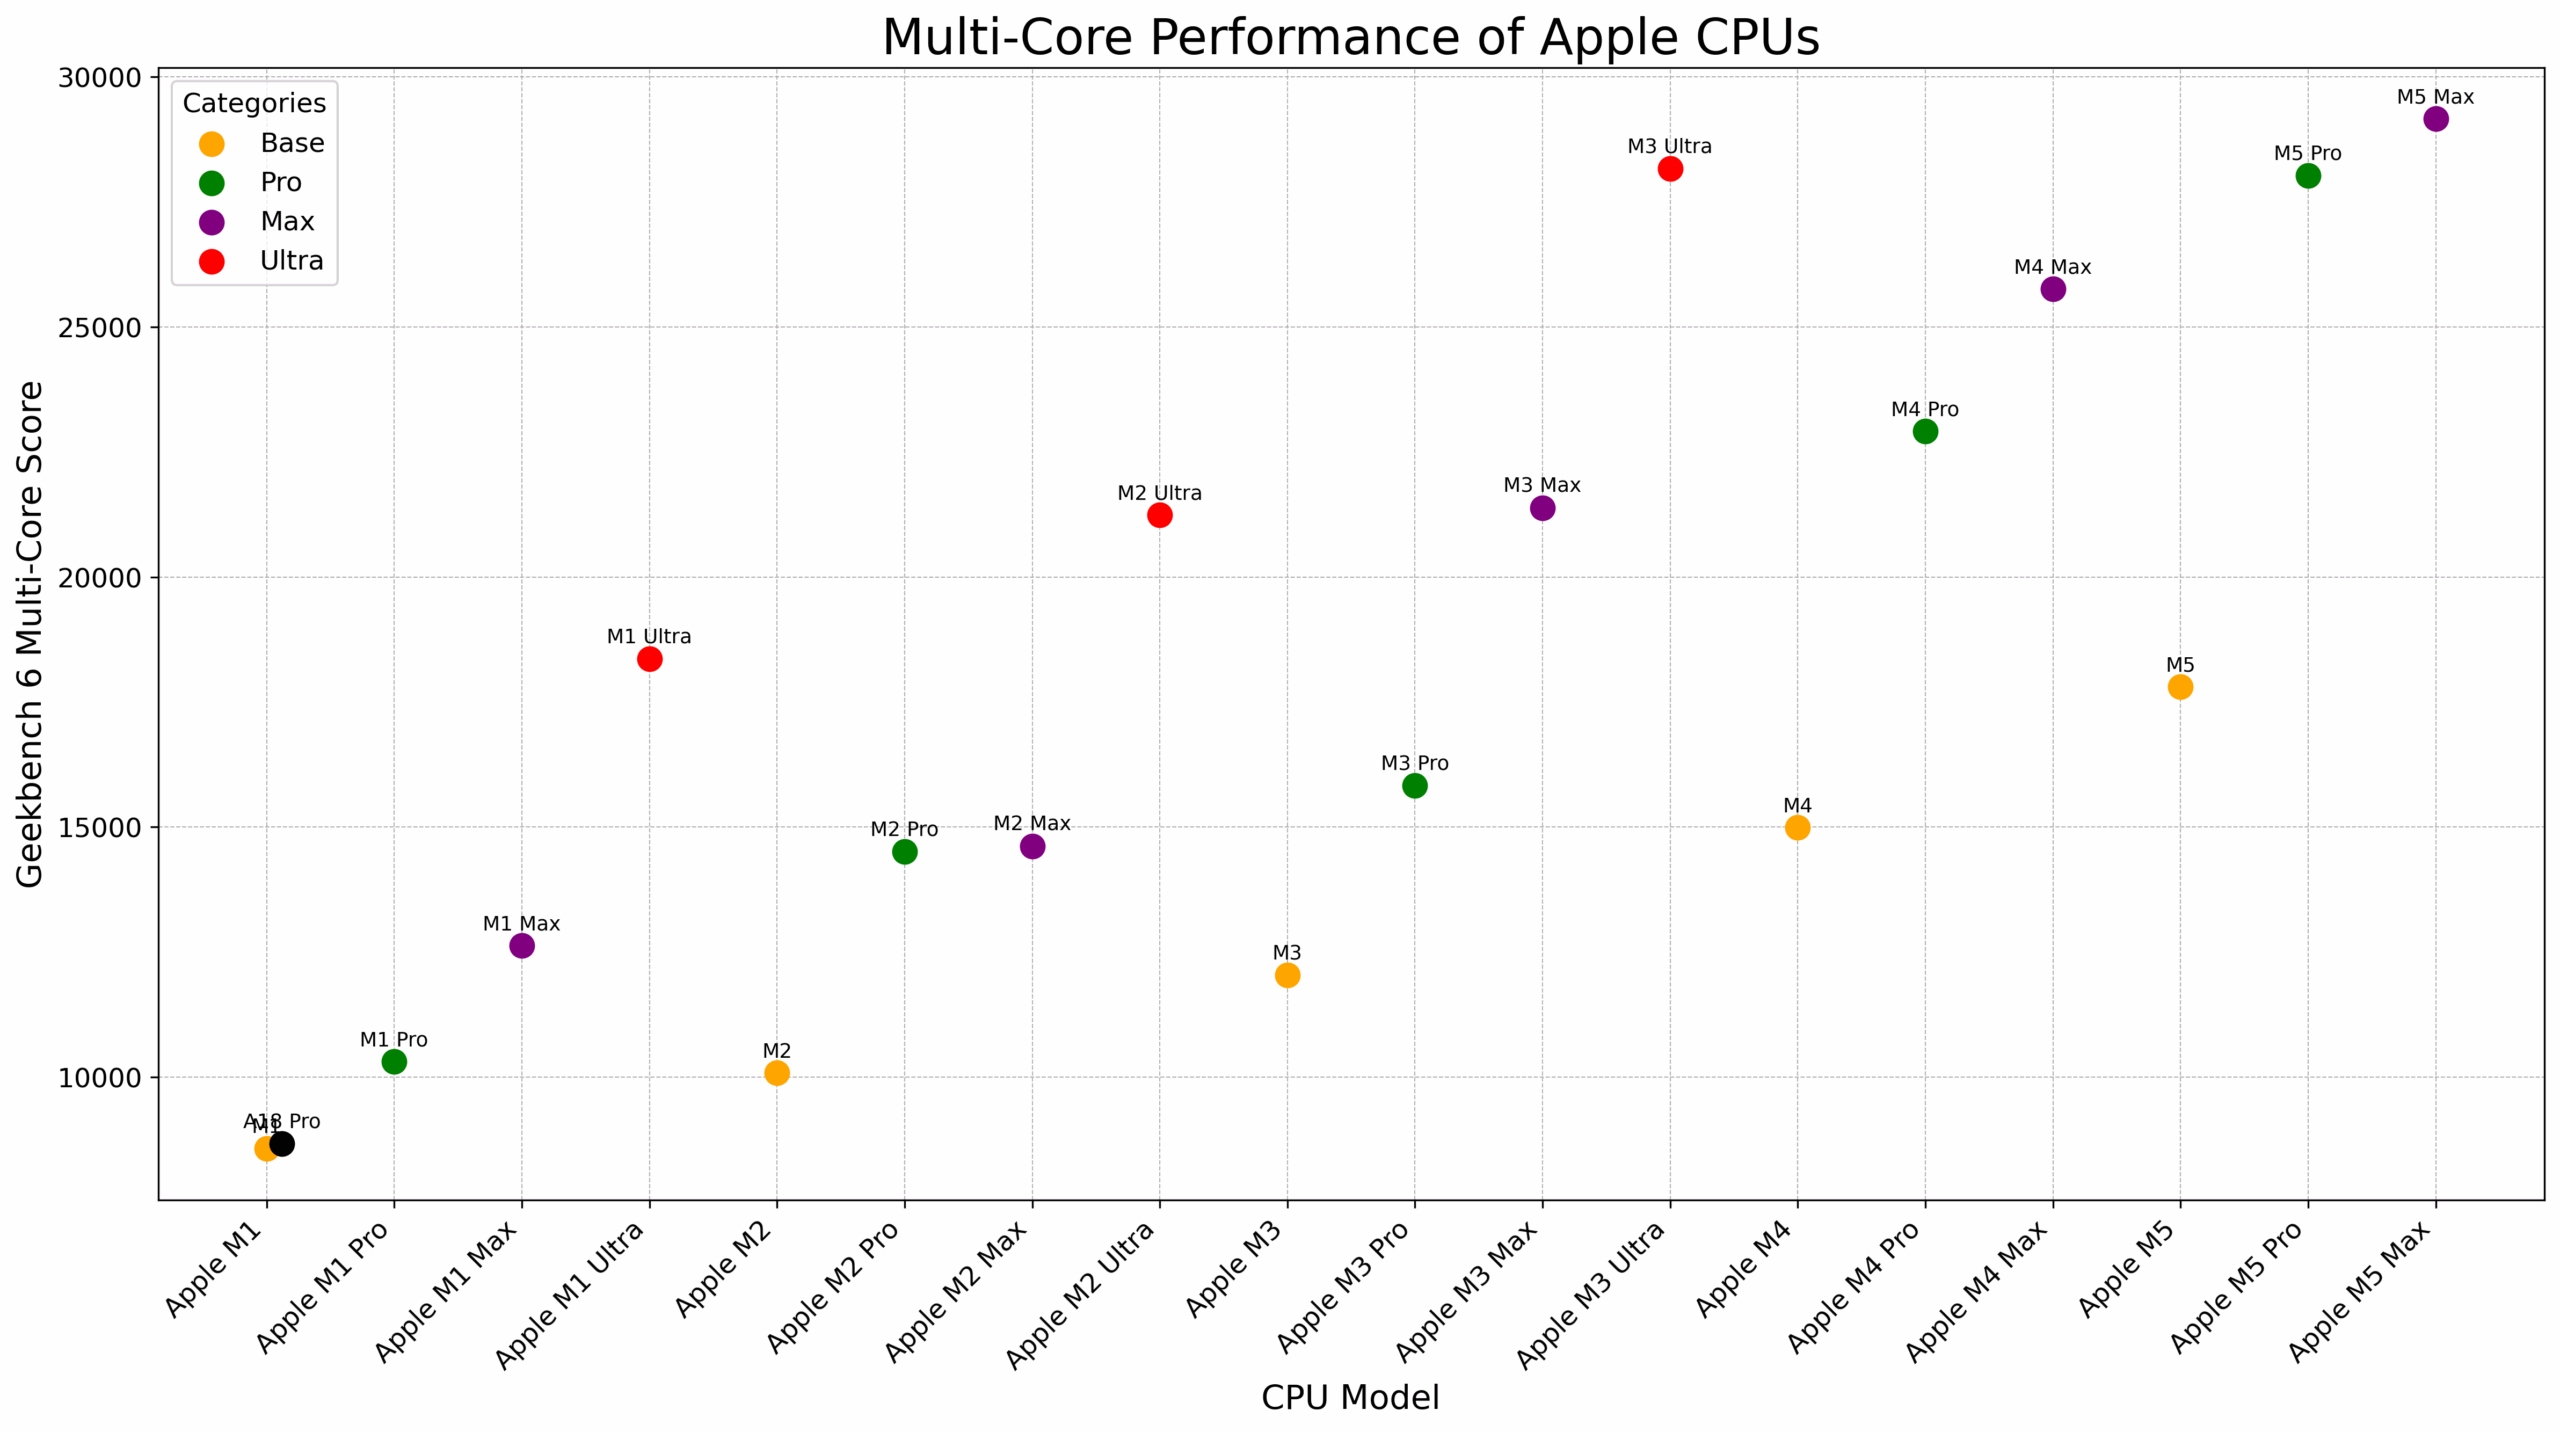
We hebben hierboven alleen de best presterende CPU-varianten uitgelicht, waar meerdere versies van hetzelfde model bestaan. Hier is de volledige lijst van alle processors uit de M-serie en hun single- en multi-core scores:
| CPU | Single-kern score | Meerkernscore |
|---|---|---|
| Apple M5 Max (CPU met 18 cores) | 4305 | 29159 |
| Apple M5 Pro (CPU met 18 cores) | 4276 | 28030 |
| Apple M5 Pro (15-core CPU) | TBD | TBD |
| Apple M5 (10-core) | 4227 | 17802 |
| Apple M5 (9-core) | 4103 | 15308 |
| Apple M4 Max (16-core) | 3880 | 25760 |
| Apple M4 Max (14-core) | 3961 | 22725 |
| Apple M4 Pro (14-core) | 3943 | 22914 |
| Apple M4 Pro (12-core) | 3922 | 20622 |
| Apple M4 (10-core) | 3830 | 14990 |
| Apple M4 (9-core) | 3671 | 13381 |
| Apple M4 (8-core) | 3650 | 13836 |
| Apple M3 Ultra (32-core CPU) | 3247 | 28169 |
| Apple M3 Ultra (CPU met 28 cores) | 3244 | 27091 |
| Apple M3 Max (16-core CPU) | 3270 | 21385 |
| Apple M3 Max (14-core CPU) | 3109 | 18490 |
| Apple M3 Pro (12-core CPU) | 3202 | 15831 |
| Apple M3 Pro (11-core CPU) | 3067 | 14453 |
| Apple M3 (8-core CPU) | 3135 | 12042 |
| Apple M2 Ultra (24-core CPU) | 2691 | 21241 |
| Apple M2 Max (12-core CPU) | 2642 | 14621 |
| Apple M2 Pro (12-core CPU) | 2678 | 14511 |
| Apple M2 Pro (10-core CPU) | 2590 | 11455 |
| Apple M2 (8-core CPU) | 2613 | 10082 |
| Apple M1 Ultra (20-core CPU) | 2405 | 18367 |
| Apple M1 Max (10-core CPU) | 2397 | 12631 |
| Apple M1 Pro (8-core CPU) | 2351 | 10307 |
| Apple M1 (8-core CPU) | 2386 | 8571 |
We hopen dat deze samenvatting je helpt bij het maken van je keuze voor een CPU uit de M-serie.
Misschien vind je onze andere analyses ook interessant:
De kloof wordt eng: Apple laat Intel achter zich
En natuurlijk mag je onze vergelijking met de nieuwkomer, de Qualcomm Snapdragon X Elite, niet missen:
Apple M4 vs Snapdragon X Elite – De CPU-strijd van de volgende generatie
 Author: Simeon NikolovEditor-in-Chief at LaptopMedia.com with 20+ years of experience in testing and analyzing laptops and mobile devices.

![[augustus 2026] Amazon Global: Top 10 van best verkochte laptops – De Apple MacBook Neo domineert de hitlijsten, terwijl goedkope en middenklasse Windows-laptops strijden om het verkoopvolume](https://laptopmedia.com/wp-content/uploads/2026/09/Best-Selling-Laptops-GLOBAL-Top-10-400x225.jpg)
![[augustus 2026] Bestverkochte laptopmerken op Amazon Global – Apple domineert qua omzet, terwijl HP koploper is qua modelvariëteit](https://laptopmedia.com/wp-content/uploads/2026/09/GLOBAL-Best-Brands-400x225.jpg)
![[augustus 2026] Amazon Global: Top 10 bestverkochte gaminglaptops – HP Victus 15 pakt de eerste plaats terwijl budgetvriendelijke modellen de hitlijsten domineren](https://laptopmedia.com/wp-content/uploads/2026/09/Best-Selling-Gaming-Laptops-GLOBAL-Top-10-400x225.jpg)
![[August 2026] Best-Selling Laptop Brands on Amazon Japan – Apple Dominates Market Share and Revenue Led by Strong Unit Sales](https://laptopmedia.com/wp-content/uploads/2026/09/CO.JP-Best-Brands-1-400x225.jpg)
![[August 2026] Best-Selling Laptop Brands on Amazon USA – Apple Dominates Market Revenue and Volume Despite Lower Model Diversity](https://laptopmedia.com/wp-content/uploads/2026/09/COM-Best-Brands-1-400x225.jpg)

这个文章总结的太棒了,什么神仙编辑,把我想要的信息都罗列出来了
这条评论真是太温暖了,让我非常开心!谢谢你,Yesir!
—
That was the most heartwarming comment; it made my day! Thank you, Yesir!
Best Apple M chips analysis
Thank you very much, wu wei!
赞 赞 赞 加鸡腿
🙂 👍
incredible comparison design. any chance for gpu/npu?
Good idea!
Great article, would love to see update with GPU performance gain comparsion too
Perfect analysis. There are all I want to get!
Hello, I don’t get the comparison with i9-14900K .. it’s just purposely written and depicted to make apple chips better … In reality i9 cpu that was used as a reference point is on the top of the list
Check this out, bro, https://versus.com/en/intel-core-i9-14900hx-vs-intel-core-i9-14900k
I had a look at your chart which does not include the M5 and the graphs above are accurate.
The i9-14900K only beats the lower spec Apple chips at multi core performance and Cinebench. It trails everywhere else.
You seem to be going off the Crossmark Overall score which is distorted by the large number of No Value results for the Apple chips because some of the tests do not run on the Macs.
I had a look at your chart which does not include the M5 and the graphs above are accurate.
The i9-14900K only beats the lower spec Apple chips at multi core performance and Cinebench. It trails everywhere else.
You seem to be going off the Crossmark Overall score which is distorted by the large number of No Value results for the Apple chips because some of the tests do not run on the Macs.
Great effort for putting together such an extensive comparison. I only wish the Y-axis started at zero because at the moment, you’ve artificially amplified the true relative difference between all of them.
Thank you, WFR! While a zero-start axis is indeed the safest choice for showing absolute performance, my goal here was slightly different. I wanted to highlight the relative uplift between generations, using the M1 (2020) as a baseline, so readers can quickly judge “how big is the jump from what I have to what I’m considering” (with the added context of Intel CPUs as well). I initially tried charts starting at zero, but the bars became compressed and the differences between closer generations were much harder to read at a glance. For example, if you’re on M4 and mostly care… Read more »
You do not show the relative uplift if you chop off the lower part of the graph.
For relative values you HAVE to show the whole enchalada, not the clipped M4 minus M1 which make the M1 zero value.
The % uplift you show in the figures actually works off the WHOLE value not a clipped value.
It would be great to have all M series Apple silicon GPU benchmarks.
每次都看这个总结,各种对比数据太清晰了,期待m5pro和max的加入,感谢你的付出
Thank you! The new models are coming to our lab, stay tuned for full analysis and reviews!
—-
谢谢!新模型即将送达我们的实验室,敬请期待完整的分析和评测!
Amazing! I was just about to do a spreadsheet on exactly this and found this site immediately. Thanks for the great work. 😃👏 All that’s missing is a “Bangs for Bucks chart” with the performance rated against price for each model. Just one suggestion. The Charts are too big for the information. If they were smaller you could take in all the information withouy scrolling. You should always start charts them from zero clipping them does not show the correct relativity. For the pricing I’d tilt the charts to axonometric view with $ as the height off the chart. We… Read more »
It would be even better if there were a graphics performance rating.
This is the most detailed and best article I have ever seen! This has provided me with great help in choosing m chips. Thank you so much!