MSI Cyborg 15 (A12V) review – there is so much power in its tiny 45W GPU
Performance: CPU, GPU, Gaming Tests
CPU options
This iteration of the machine can be found with the Core i5-12450H or the Core i7-12650H.
Results are from the Cinebench R23 CPU test (the higher the score, the better)

Results are from our Photoshop benchmark test (the lower the score, the better)
MSI Cyborg 15 (A12Vx / A13Ux / A13Vx) CPU variants
Here you can see an approximate comparison between the CPUs that can be found in the MSI Cyborg 15 (A12Vx / A13Ux / A13Vx) models on the market. This way you can decide for yourself which MSI Cyborg 15 (A12Vx / A13Ux / A13Vx) model is the best bang for your buck.
Note: The chart shows the cheapest different CPU configurations so you should check what the other specifications of these laptops are by clicking on the laptop’s name / CPU.
Results are from the Cinebench R23 CPU test (the higher the score, the better)
Results are from our Photoshop benchmark test (the lower the score, the better)
GPU options
In terms of graphics, you get to choose between the RTX 4050, and the RTX 4060. Both of them have a 45W TGP.
Results are from the 3DMark: Time Spy (Graphics) benchmark (higher the score, the better)
Results are from the 3DMark: Fire Strike (Graphics) benchmark (higher the score, the better)
Results are from the 3DMark: Wild Life benchmark (higher the score, the better)
Results are from the Unigine Superposition benchmark (higher the score, the better)
MSI Cyborg 15 (A12Vx / A13Ux / A13Vx) GPU variants
Here you can see an approximate comparison between the GPUs that can be found in the MSI Cyborg 15 (A12Vx / A13Ux / A13Vx) models on the market. This way you can decide for yourself which MSI Cyborg 15 (A12Vx / A13Ux / A13Vx) model is the best bang for your buck.
Note: The chart shows the cheapest different GPU configurations so you should check what the other specifications of these laptops are by clicking on the laptop’s name / GPU.
Results are from the 3DMark: Time Spy (Graphics) benchmark (higher the score, the better)
Results are from the 3DMark: Fire Strike (Graphics) benchmark (higher the score, the better)
Results are from the 3DMark: Wild Life (Graphics) benchmark (higher the score, the better)
Results are from the Unigine Superposition benchmark (higher the score, the better)
Gaming tests

| Metro Exodus | Full HD, Low (Check settings) | Full HD, High (Check settings) | Full HD, Extreme (Check settings) |
|---|---|---|---|
| Average FPS | 121 fps | 60 fps | 27 fps |

| Borderlands 3 | Full HD, Medium (Check settings) | Full HD, High (Check settings) | Full HD, Badass (Check settings) |
|---|---|---|---|
| Average fps | 102 fps | 74 fps | 57 fps |

| Tom Clancy’s Ghost Recon Wildlands | Full HD, High (Check settings) | Full HD, Very High (Check settings) | Full HD, Ultra (Check settings) |
|---|---|---|---|
| Average | 93 fps | 80 fps | 53 fps |

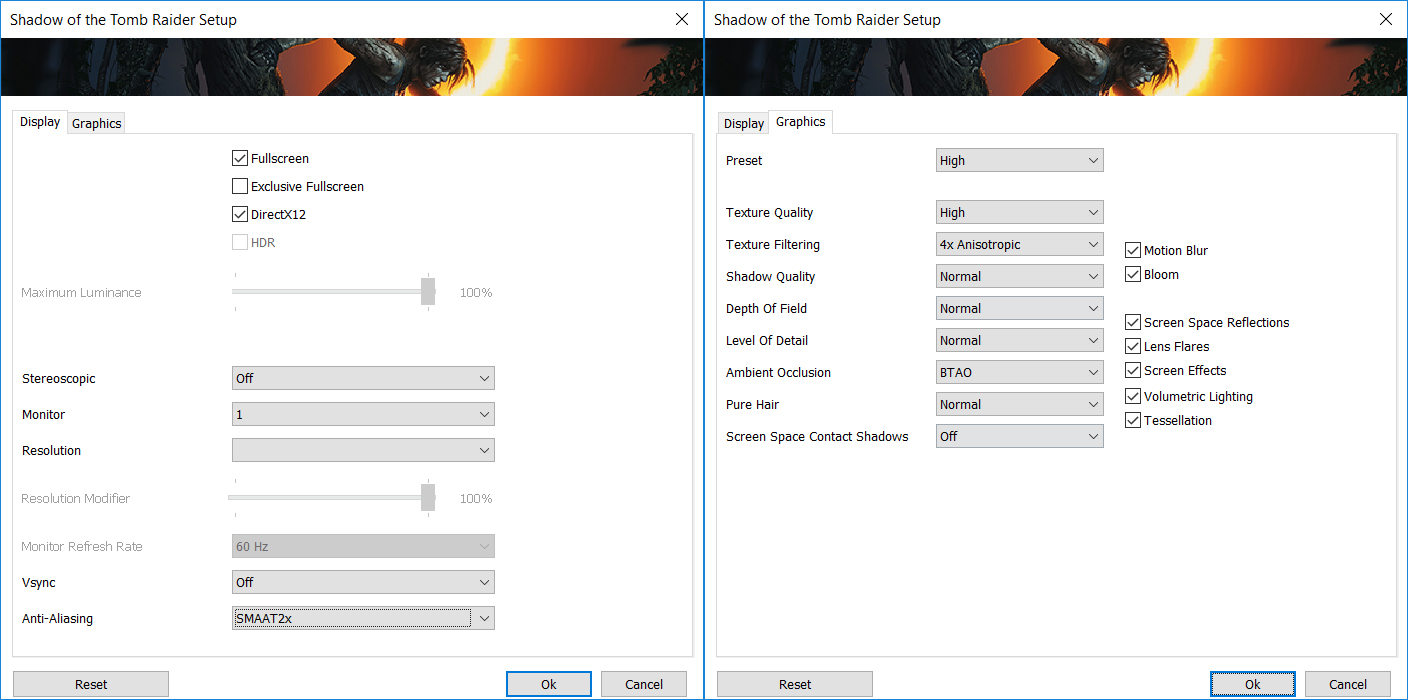
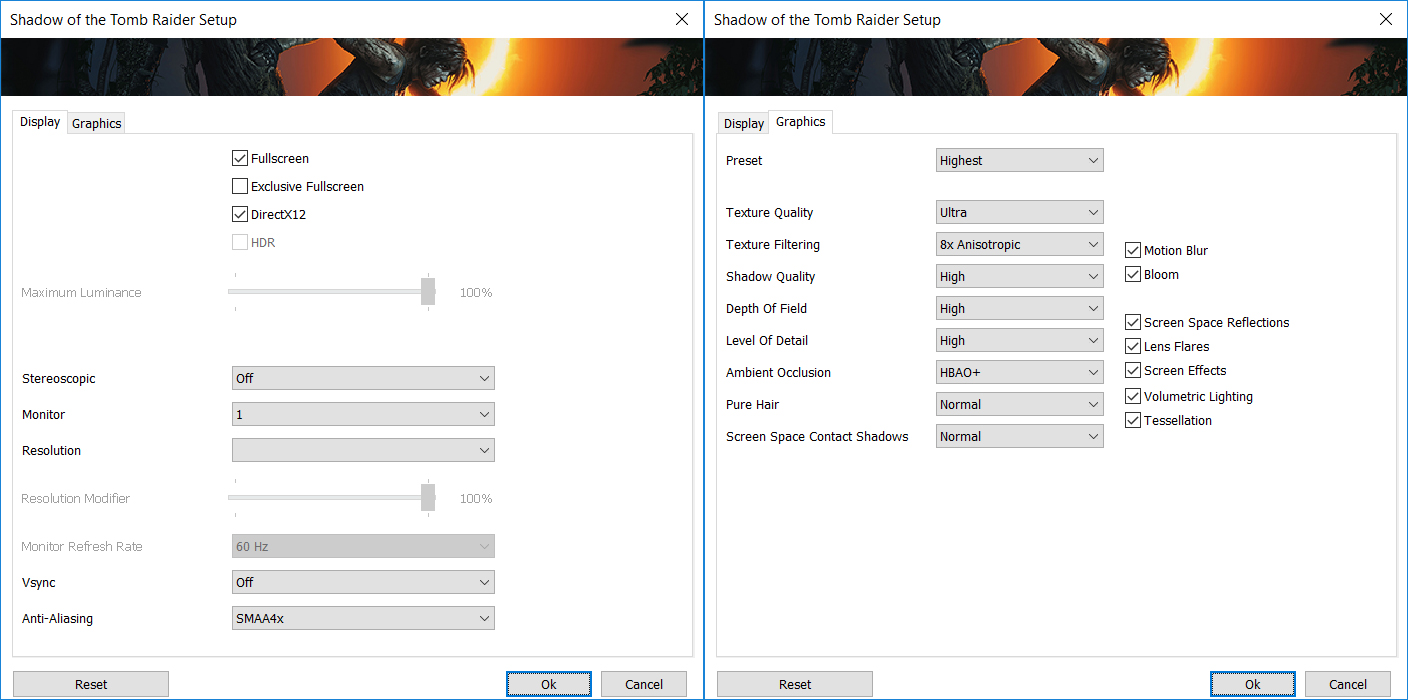
| Shadow of the Tomb Raider (2018) | Full HD, Medium (Check settings) | Full HD, High (Check settings) | Full HD, Highest (Check settings) |
|---|---|---|---|
| Average | 108 fps | 99 fps |


