苹果 M5 与 M4、M3、M2、M1(+Pro/Max/Ultra):全面对比!
苹果公司独具匠心地设计了 M 系列 CPU,使其像乐高积木一样,可以配对使用,创造出更强大的芯片。例如,M-Ultra 芯片实质上是两个 M-Max CPU 的组合,能有效地将资源翻倍,挑战所有英特尔和 AMD CPU。不过,今天的重点不是蓝队和红队,而是比较所有四代 M 系列处理器。
此外,我们还将为苹果 M5 Pro、M5 Max 和 M5 Ultra,当然还有失踪的 M4 Ultra 提供预测分数。开始吧
[01/2025] 已更新:添加苹果 M4(8 核 CPU)、M4(10 核 CPU)、M4 Pro(12 核 CPU)、M4 Pro(14 核 CPU)、M4 Max(14 核 CPU)和 M4 Max(16 核 CPU)
[03/2025] 已更新:添加了 Apple M3 Ultra
[11/2025] 已更新:已添加 Apple M5(9 核和 10 核)
[03/2026] 已更新:添加 A18 Pro、Apple M5 Pro(15 核和 18 核)和 Apple M5 Max
苹果 CPU 阵容 – 完整列表
每一代 Apple 芯片都会带来重大升级,因为 Apple 每年都会推出更强大、更高效的架构:
| Apple SoC | 超级/性能/效率 内核 | GPU 内核 | 内存 带宽 | 晶体管 |
| Apple M5 Max(18 核 CPU,40c GPU) | 6S+12P | 40 | 614 GB/s | – |
| Apple M5 Max(18 核 CPU,32c GPU) | 6S+12P | 32 | 460 GB/s | – |
| Apple M5 Pro(18 核 CPU) | 6S+12P | 20 | 307 GB/s | – |
| Apple M5 Pro(15 核 CPU) | 5S+10P | 16 | 307 GB/s | – |
| 苹果 M5(10 核 CPU) | 4P+6E | 10 | 153 GB/s | – |
| Apple A18 Pro(MacBook Neo) | 2P+4E | 5 | 60 GB/s | – |
| Apple M5(9 核 CPU) | 3P+6E | 10 | 153 GB/s | – |
| Apple M4 Max(16 核 CPU) | 12P+4E | 40 | 546 GB/s | – |
| Apple M4 Max(14 核 CPU) | 10P+4E | 32 | 410 GB/s | – |
| Apple M4 Pro(14 核 CPU) | 10P+4E | 20 | 273 GB/s | – |
| Apple M4 Pro(12 核 CPU) | 8P+4E | 16 | 273 GB/s | – |
| Apple M4(10 核 CPU) | 4P+6E | 10 | 120 GB/s | 280 亿 |
| Apple M4(9 核 CPU) | 3P+6E | 8 | 120 GB/s | 280 亿 |
| Apple M4(8 核 CPU) | 4P+4E | 8 | 120 GB/s | 280 亿 |
| Apple M3 Ultra(32 核 CPU) | 24P+8E | 80 | 819.3 GB/s | 1,840 亿 |
| Apple M3 Ultra(28 核 CPU) | 20P+8E | 60 | 819.3 GB/s | 1,840 亿 |
| Apple M3 Max(16 核 CPU) | 12P+4E | 30 或 40 | 408.6 GB/s | 920 亿 |
| Apple M3 Max(14 核 CPU) | 10P+4E | 30 或 40 | 307.2 GB/s | 920 亿 |
| Apple M3 Pro(12 核 CPU) | 6P+6E | 14 或 16 | 153.6 GB/s | 370 亿 |
| Apple M3 Pro(11 核 CPU) | 5P+6E | 14 或 16 | 153.6 GB/s | 370 亿 |
| Apple M3(8 核 CPU) | 4P+4E | 8 或 10 | 102.4 GB/s | 250 亿 |
| Apple M2 Ultra(24 核 CPU) | 16P+8E | 60 或 76 | 819.2 GB/s | 1,340 亿 |
| Apple M2 Max(12 核 CPU) | 8P+4E | 30 或 38 | 409.6 GB/s | 670 亿 |
| Apple M2 Pro(12 核 CPU) | 6P+4E | 16 或 19 | 204.8 GB/s | 400 亿 |
| Apple M2 Pro(10 核 CPU) | 6P+4E | 16 或 19 | 204.8 GB/s | 400 亿 |
| Apple M2(8 核 CPU) | 4P+4E | 8 或 10 | 102.4 GB/s | 200 亿 |
| Apple M1 Ultra(20 核 CPU) | 16P+4E | 64 | 819.2 GB/s | 1 140 亿 |
| Apple M1 Max(10 核 CPU) | 8P+2E | 24 或 32 | 409.6 GB/s | 570 亿 |
| Apple M1 Pro(10 核 CPU) | 8P+2E | 16 | 204.8 GB/s | 337 亿 |
| Apple M1 Pro(8 核 CPU) | 6P+2E | 14 | 204.8 GB/s | 337 亿 |
| Apple M1(8 核 CPU) | 4P+4E | 7 或 8 | 68.3 GB/s | 160 亿 |
苹果 M1 vs M2 vs M3 vs M4 vs M5
首先,我们来看看 M 系列 CPU 的 “基本 “变体的发展情况。
以下是这些基本型号的单核性能汇总,展示了各代产品的性能分数和百分比改进。
单核性能
在游戏或软件编译等严重依赖处理器内核速度的应用中,单核性能对于提供最佳速度至关重要。它在决定操作系统和实用程序的整体响应速度和效率方面也发挥着重要作用,即使在无法使用多核优化的情况下也能确保流畅的用户体验。
我们在笔记本电脑 CPU 排行榜中加入了性能最好的英特尔芯片–英特尔酷睿 Ultra 9 285HX(3124 分),以供参考。它与苹果 M3 几乎完全一致。MacBook Neo 中的苹果 A18 Pro 正好介于 M3 和 M4 之间。
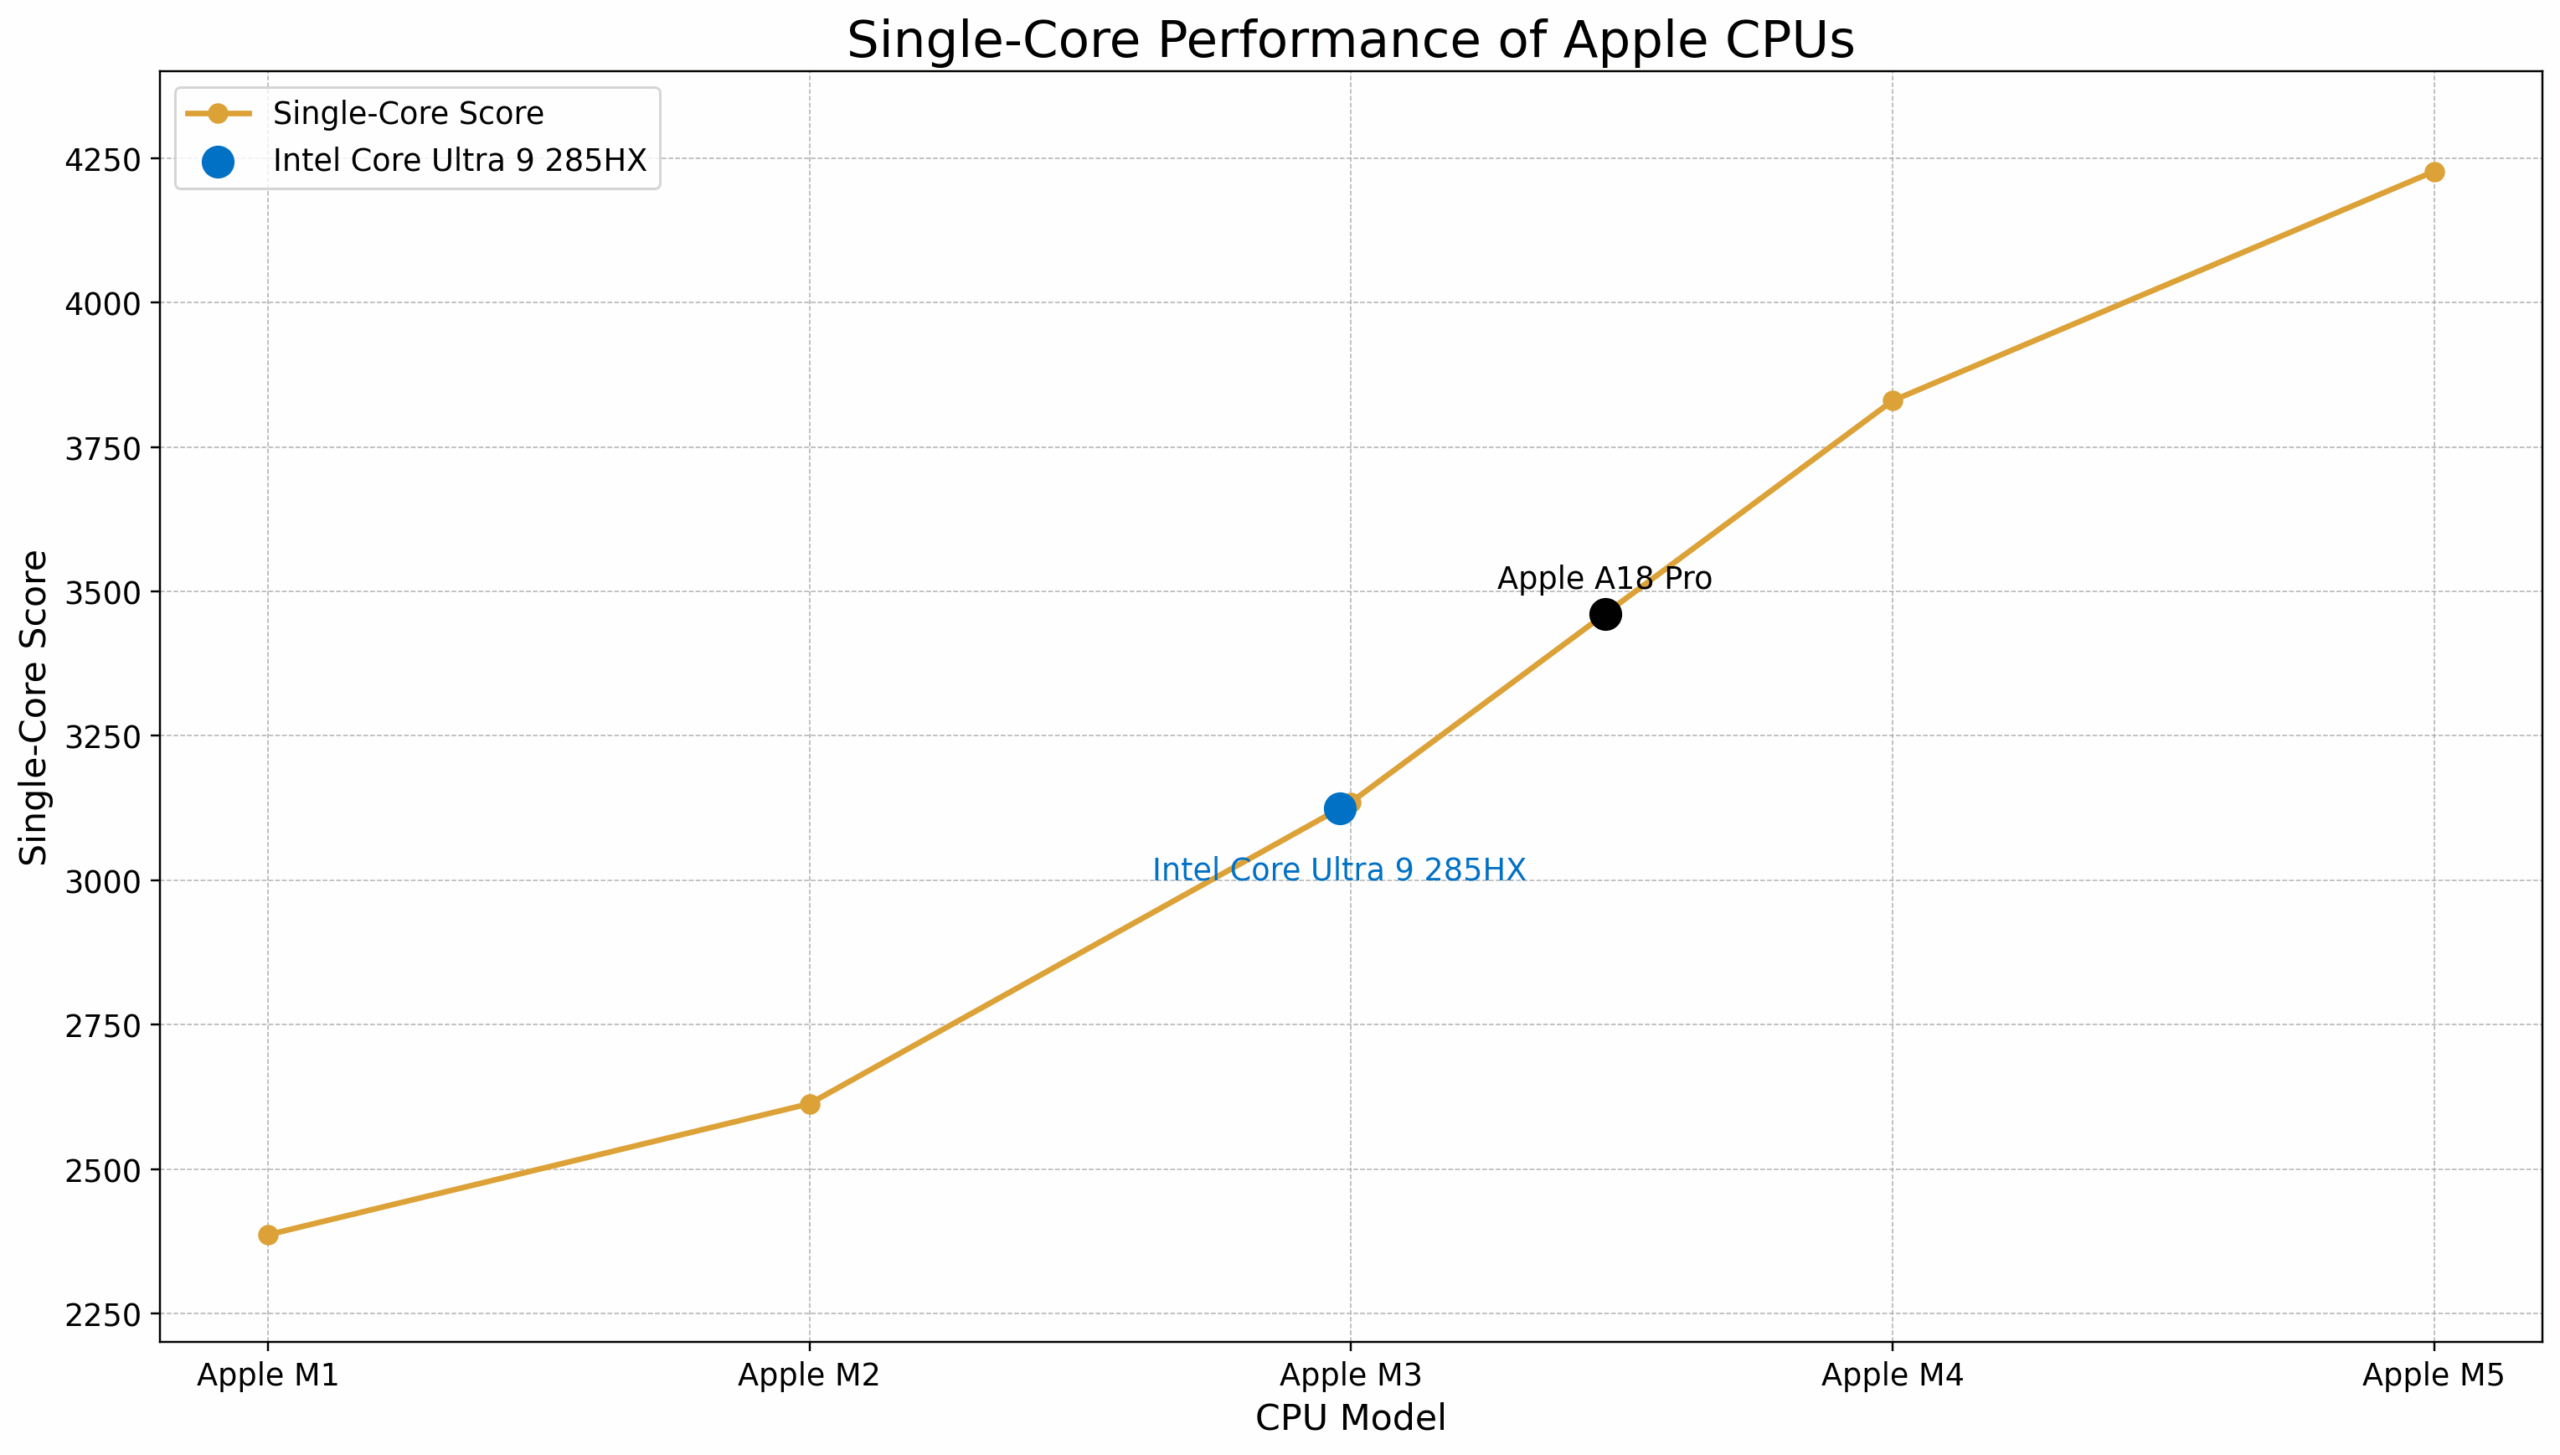
| CPU | Geekbench 6 单核 | 性能提升 (%) |
| 苹果 M1 | 2386 | – |
| 苹果 M2 | 2613 | +10% |
| 苹果 M3 | 3135 | +20% |
| 苹果 A18 Pro(MacBook Neo) | 3461 | – |
| 苹果 M4 | 3830 | +22% |
| 苹果 M5 | 4227 | +10% |
| 平均性能跃升+16% | ||
Apple M4 代表了单核性能方面迄今最显著的飞跃。
M4 还有两个 “经过修剪 “的变体–8 核 Apple M4可以在最经济实惠的 iMac 中找到,9 核 Apple M4可以在最经济实惠的 iPad Pro 中找到:
| CPU | Geekbench 6 单核 | 性能提升 (%) |
| 苹果 M4(8 核,iMac) | 3650 | |
| Apple M4(9 核,iPad) | 3671 | +0.5% |
| 苹果 M4(10 核,MacBook Pro) | 3830 | +4% |
多核性能
多核性能对于处理视频编辑、三维渲染和科学模拟等复杂而繁重的任务至关重要。
下表详细介绍了 Apple 基本 M 系列 CPU 的多核性能,并着重说明了每一代处理器的性能提升和得分提高。此外,我们还添加了笔记本电脑 CPU 性能排行榜中性能最高的英特尔芯片 Intel Core Ultra 9 285HX,其得分为 22215 分。
MacBook Neo 中的苹果 A18 Pro 仅次于苹果 M1 芯片。
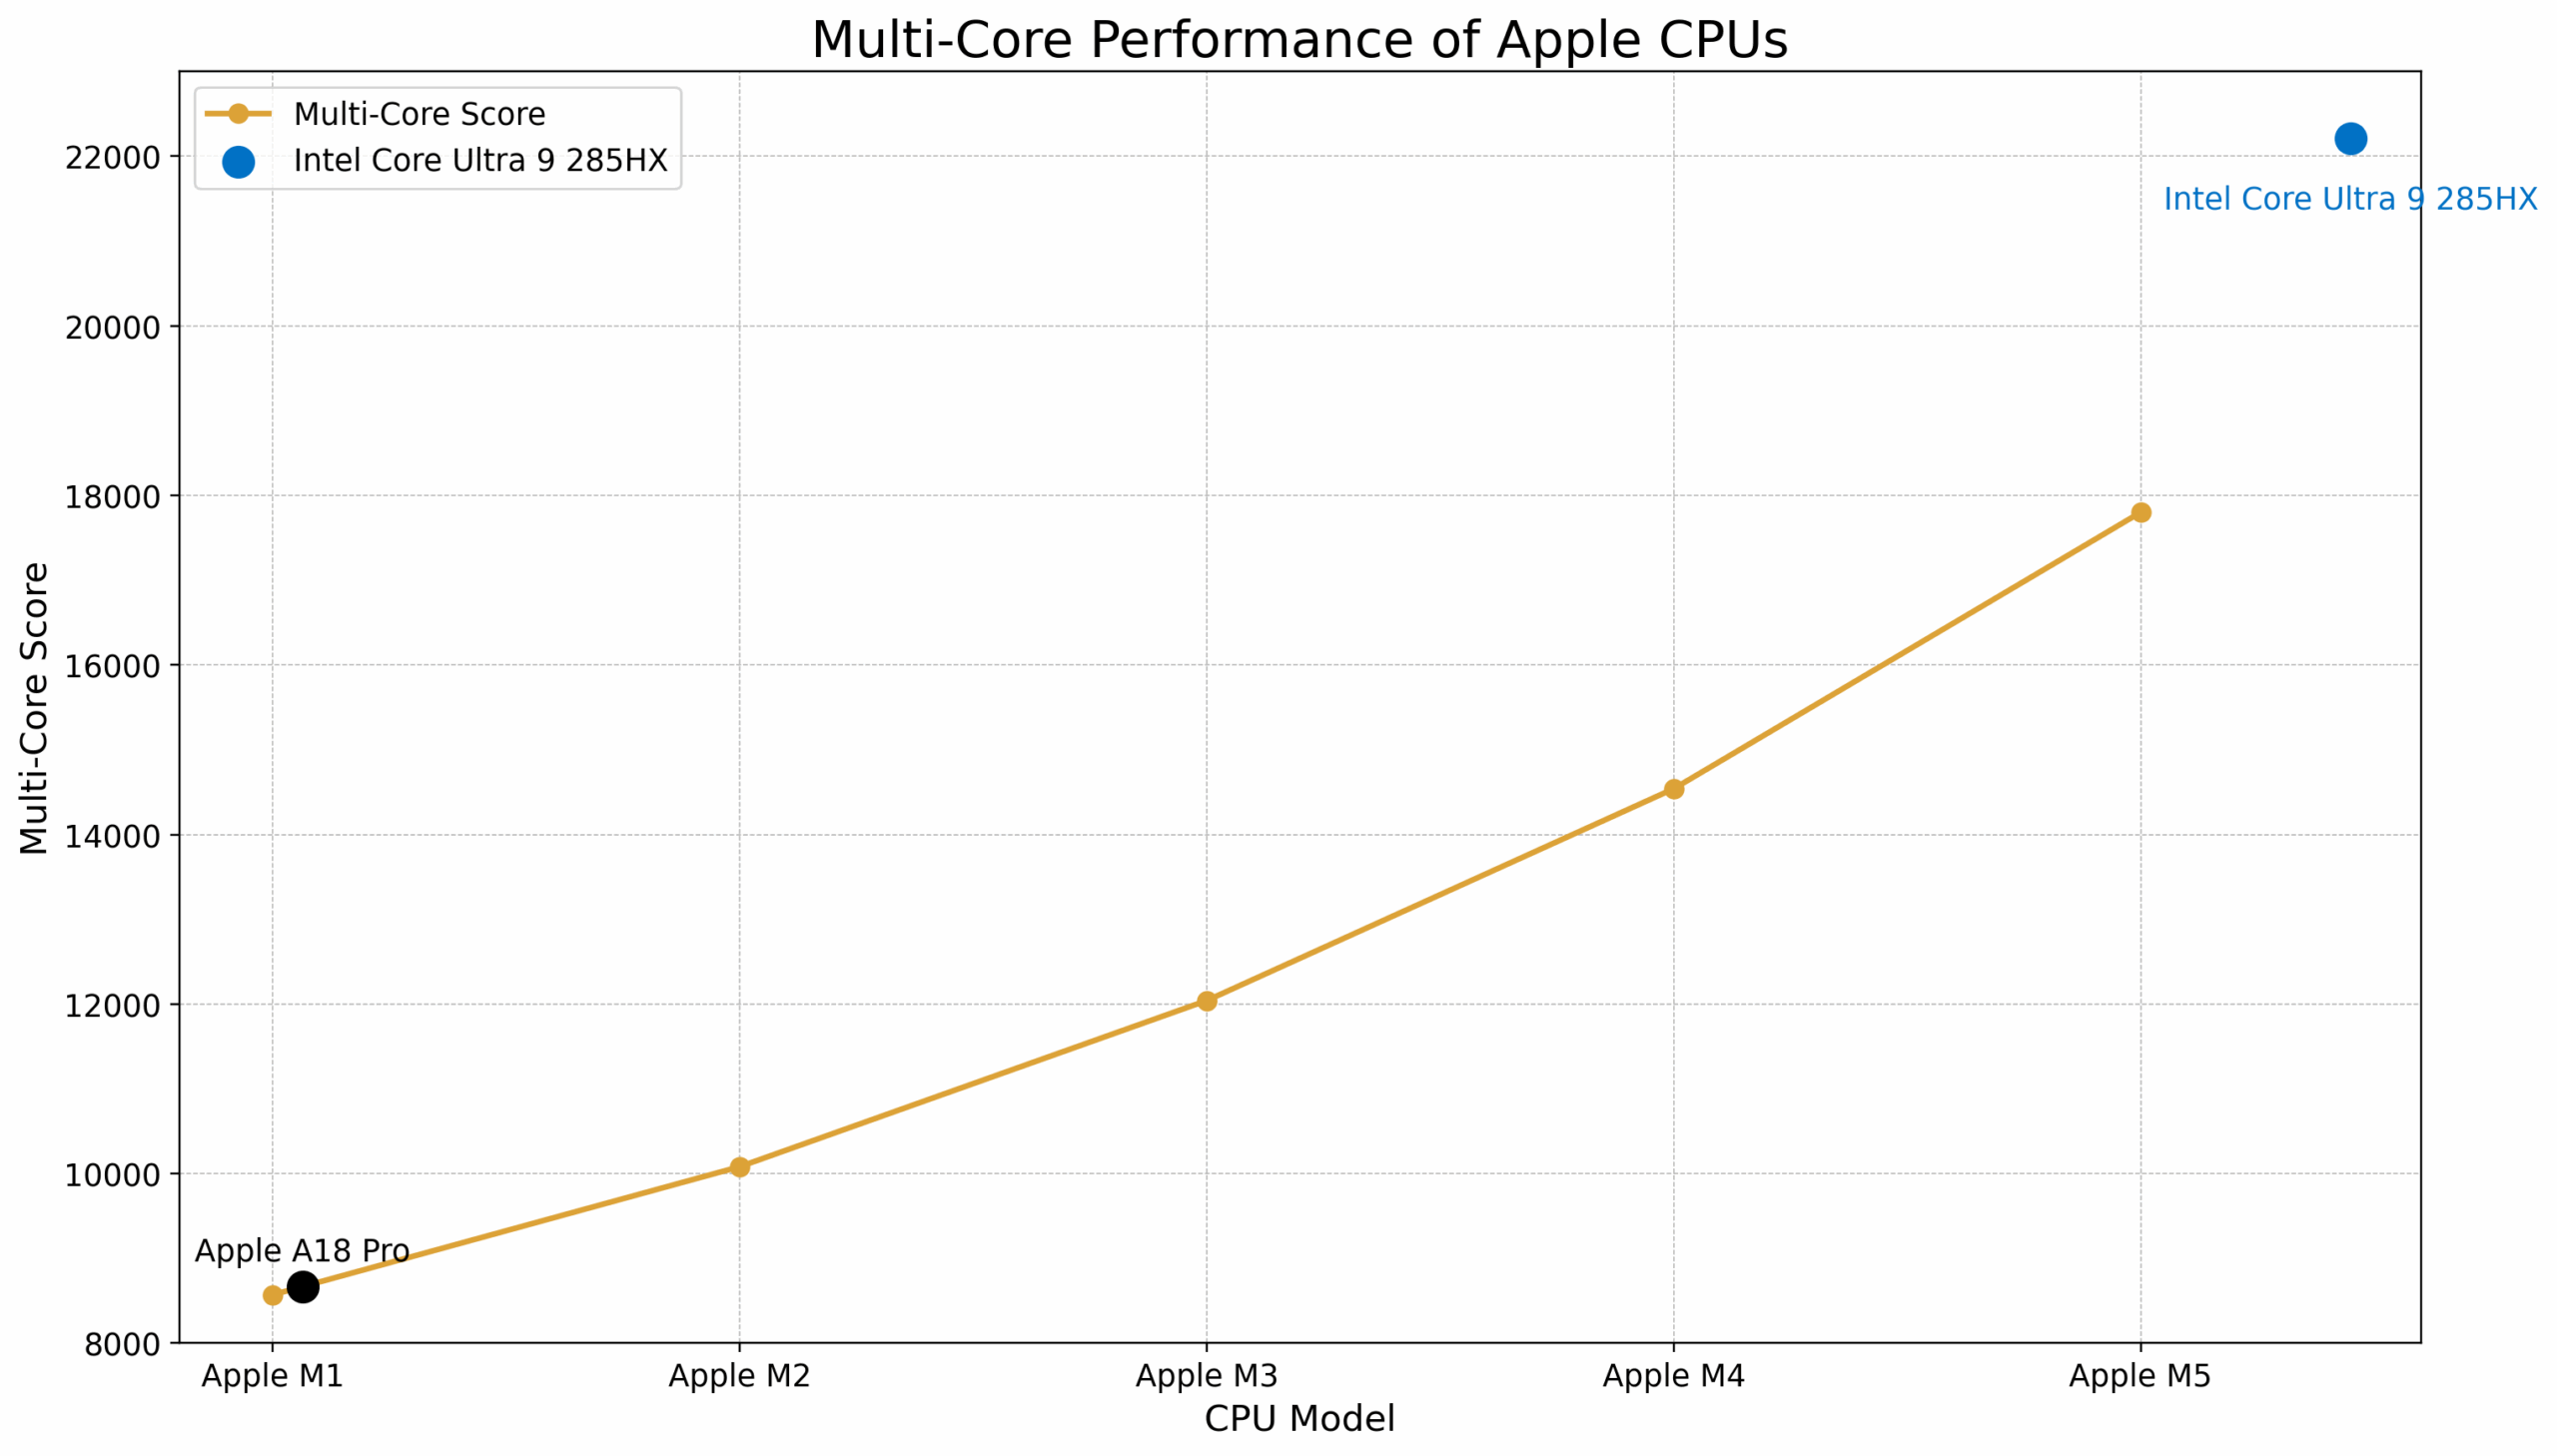
| CPU | Geekbench 6 多核 | 性能提升 (%) |
| 苹果 M1 | 8571 | – |
| Apple A18 Pro(MacBook Neo) | 8668 | – |
| 苹果 M2 | 10082 | +18% |
| 苹果 M3 | 12042 | +19% |
| 苹果 M4 | 14541 | +21% |
| 苹果 M5 | 17802 | +22% |
| 平均性能跃升:+20% | ||
多核性能的发展趋势与单核性能的提升非常接近,最新的 M5 标志着最大幅度的提升。不过,在复杂任务中,基本型号仍落后于英特尔旗舰产品酷睿至尊 9 285HX。
下面是 M4 变体的比较:
| CPU | 性能 内核 | Geekbench 6 多核 | 性能提升 (%) |
| 苹果 M4(9 核,iPad) | 3 | 13 381 | |
| 苹果 M4(8 核,iMac) | 4 | 13 836 | +3% |
| 苹果 M4(10 核,MacBook Pro) | 4 | 14 990 | +8% |
现在,让我们将其与苹果 M 系列的 Pro、Max 和 Ultra 机型进行比较。
苹果 M1 Pro vs M2 Pro vs M3 Pro vs M4 Pro vs M5 Pro
14 核 M4 Pro 拥有 10 个性能核心,性能大幅提升 45%!这比英特尔的移动旗舰产品英特尔酷睿 Ultra 9 285HX 高出 3%。因此,Ultra 9 285HX 的单核速度与苹果 M3 差不多,多核速度与苹果 M4 Pro 差不多。
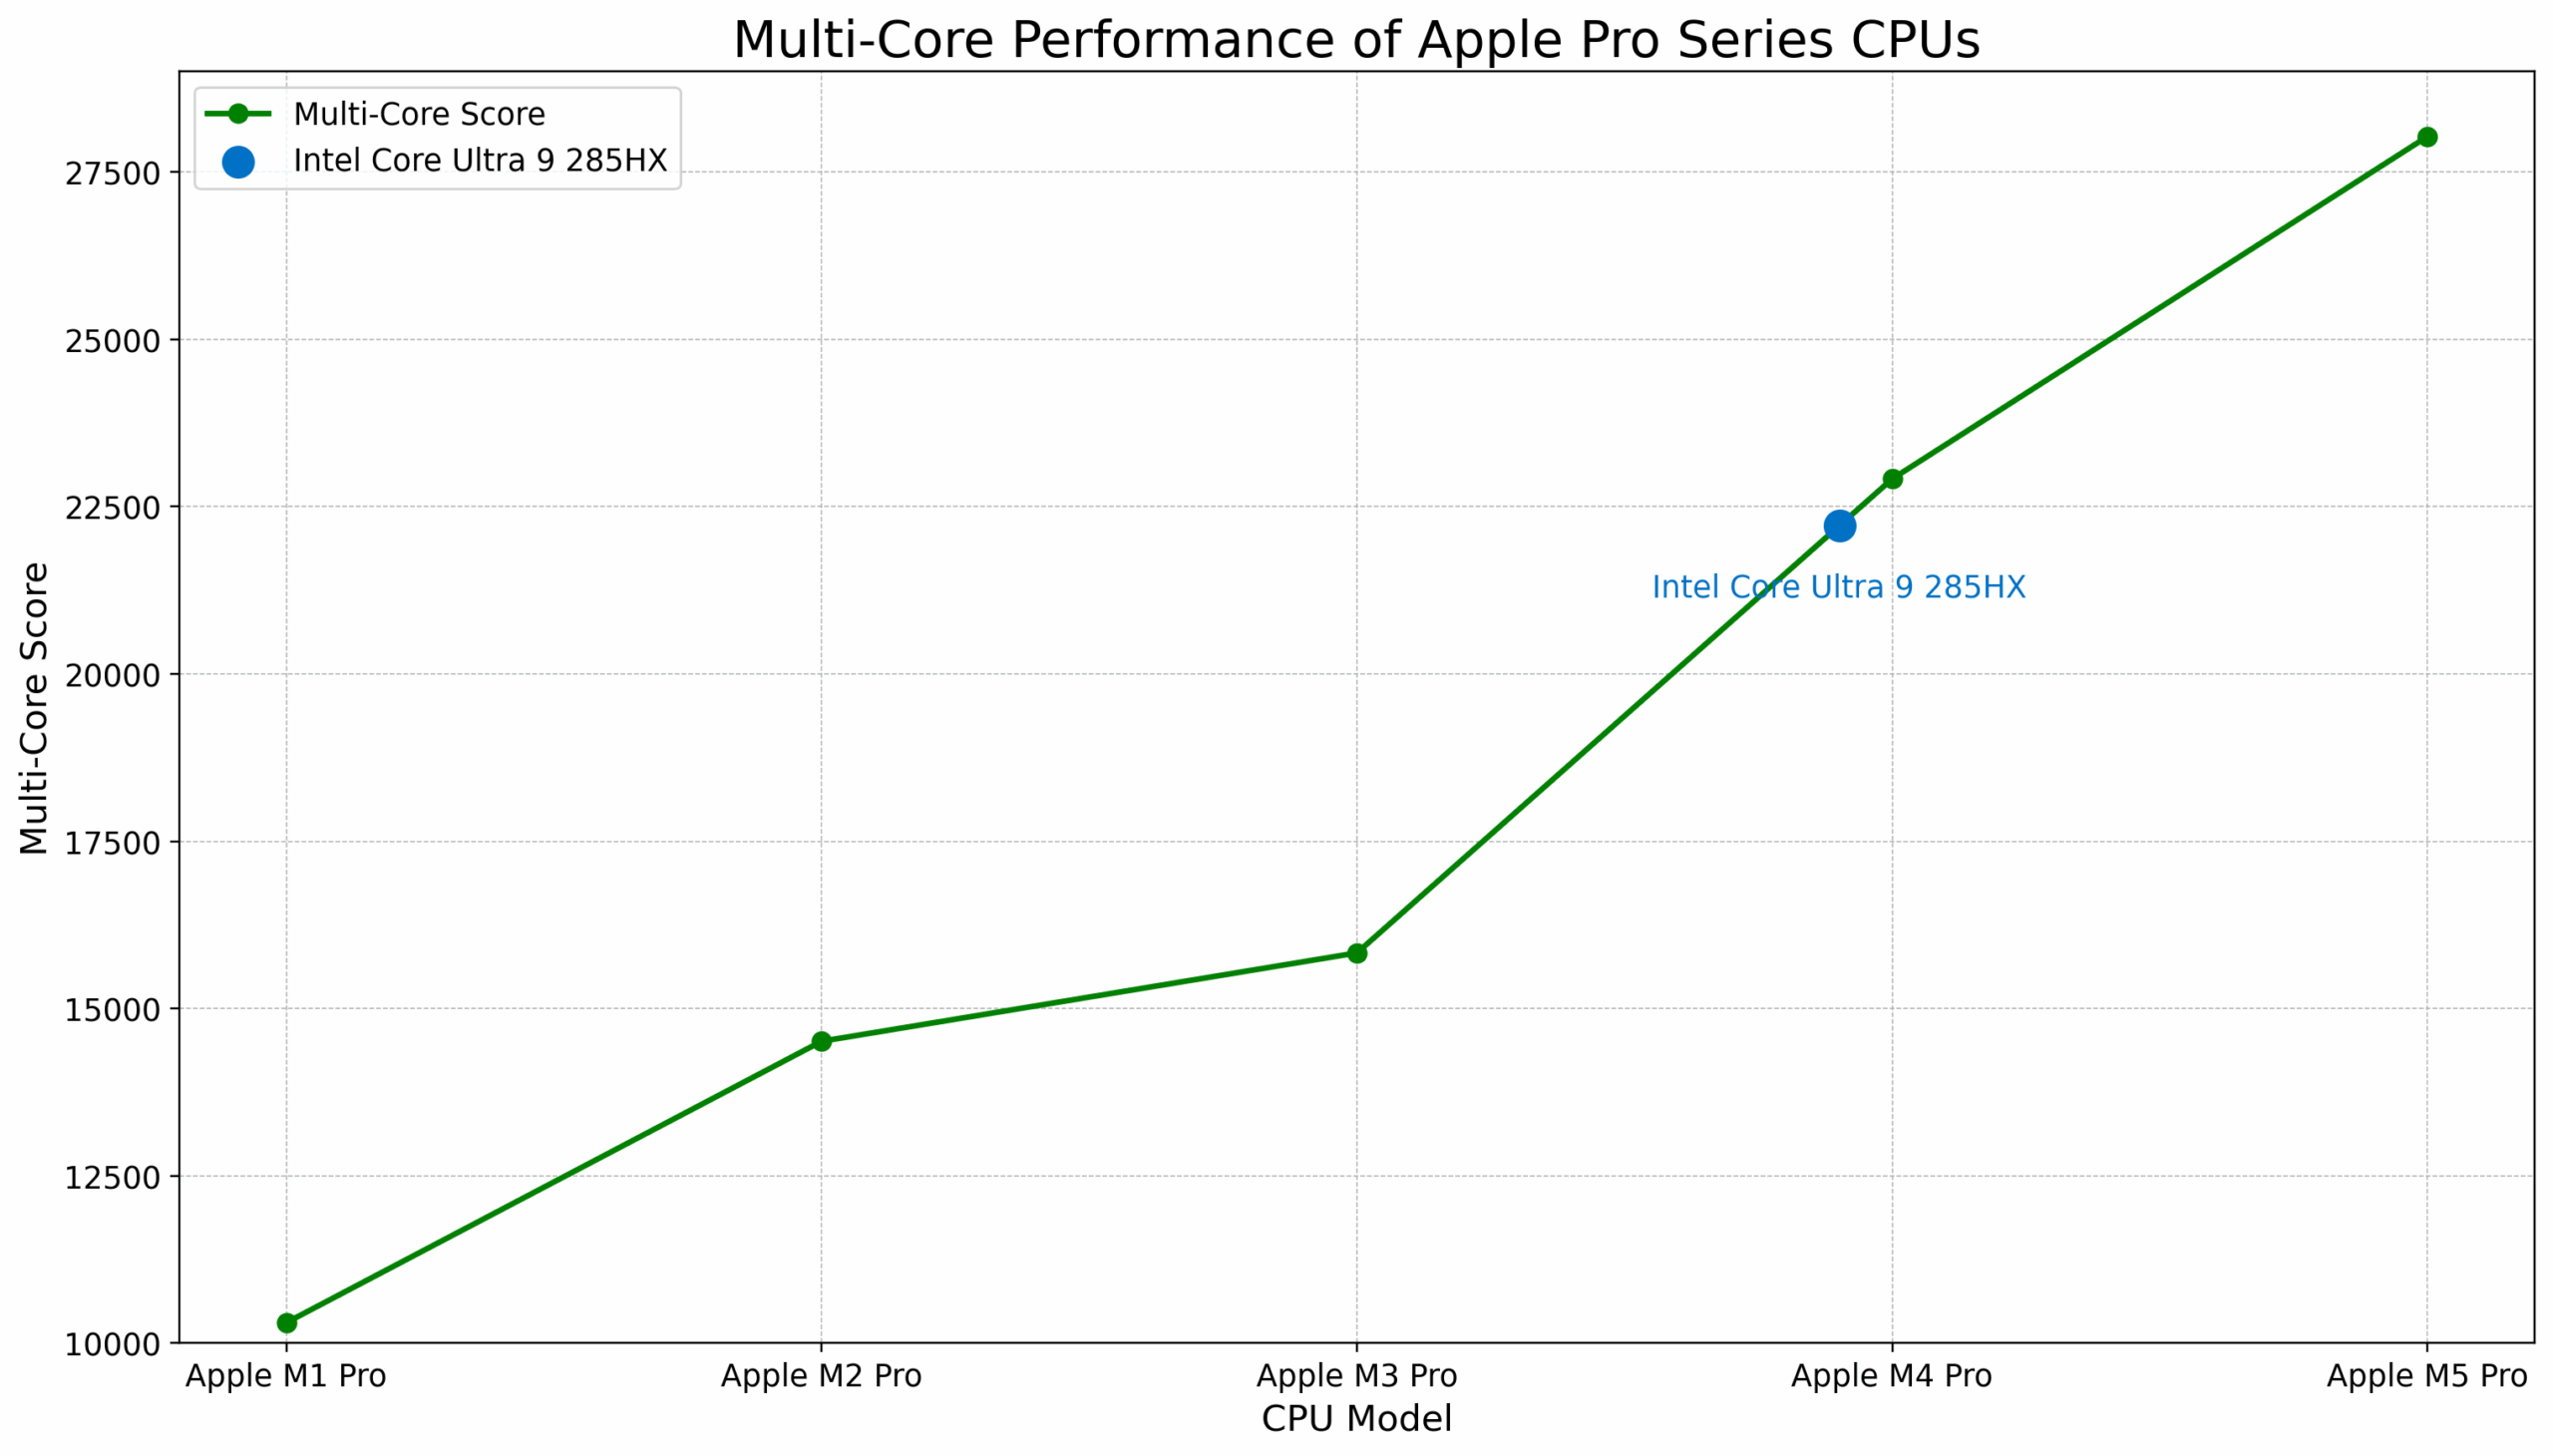
| CPU | Geekbench 6 多核 | 性能提升 (%) |
| 苹果 M1 Pro(8 核 CPU) | 10 307 | |
| 苹果 M2 Pro(12 核 CPU) | 14 511 | +41% |
| 苹果 M3 Pro(12 核 CPU) | 15 831 | +9% |
| 苹果 M4 Pro(14 核 CPU) | 22 914 | +45% |
| 苹果 M5 Pro(18 核 CPU) | 28030 | +22% |
| 平均性能提升29% | ||
苹果 M1 Max vs M2 Max vs M3 Max vs M4 Max vs M5 Max
在比较移动处理器时,M3 Max 是唯一一款性能超过英特尔当时的旗舰产品 i9-14900HX 的苹果处理器。现在的蓝色旗舰是Intel Core Ultra 9 285HX,其多核性能仅在 M3 Max 和 M4 Max 之间。
M5 Max 得分为 29 159 分,比 285HX 高出 31%:
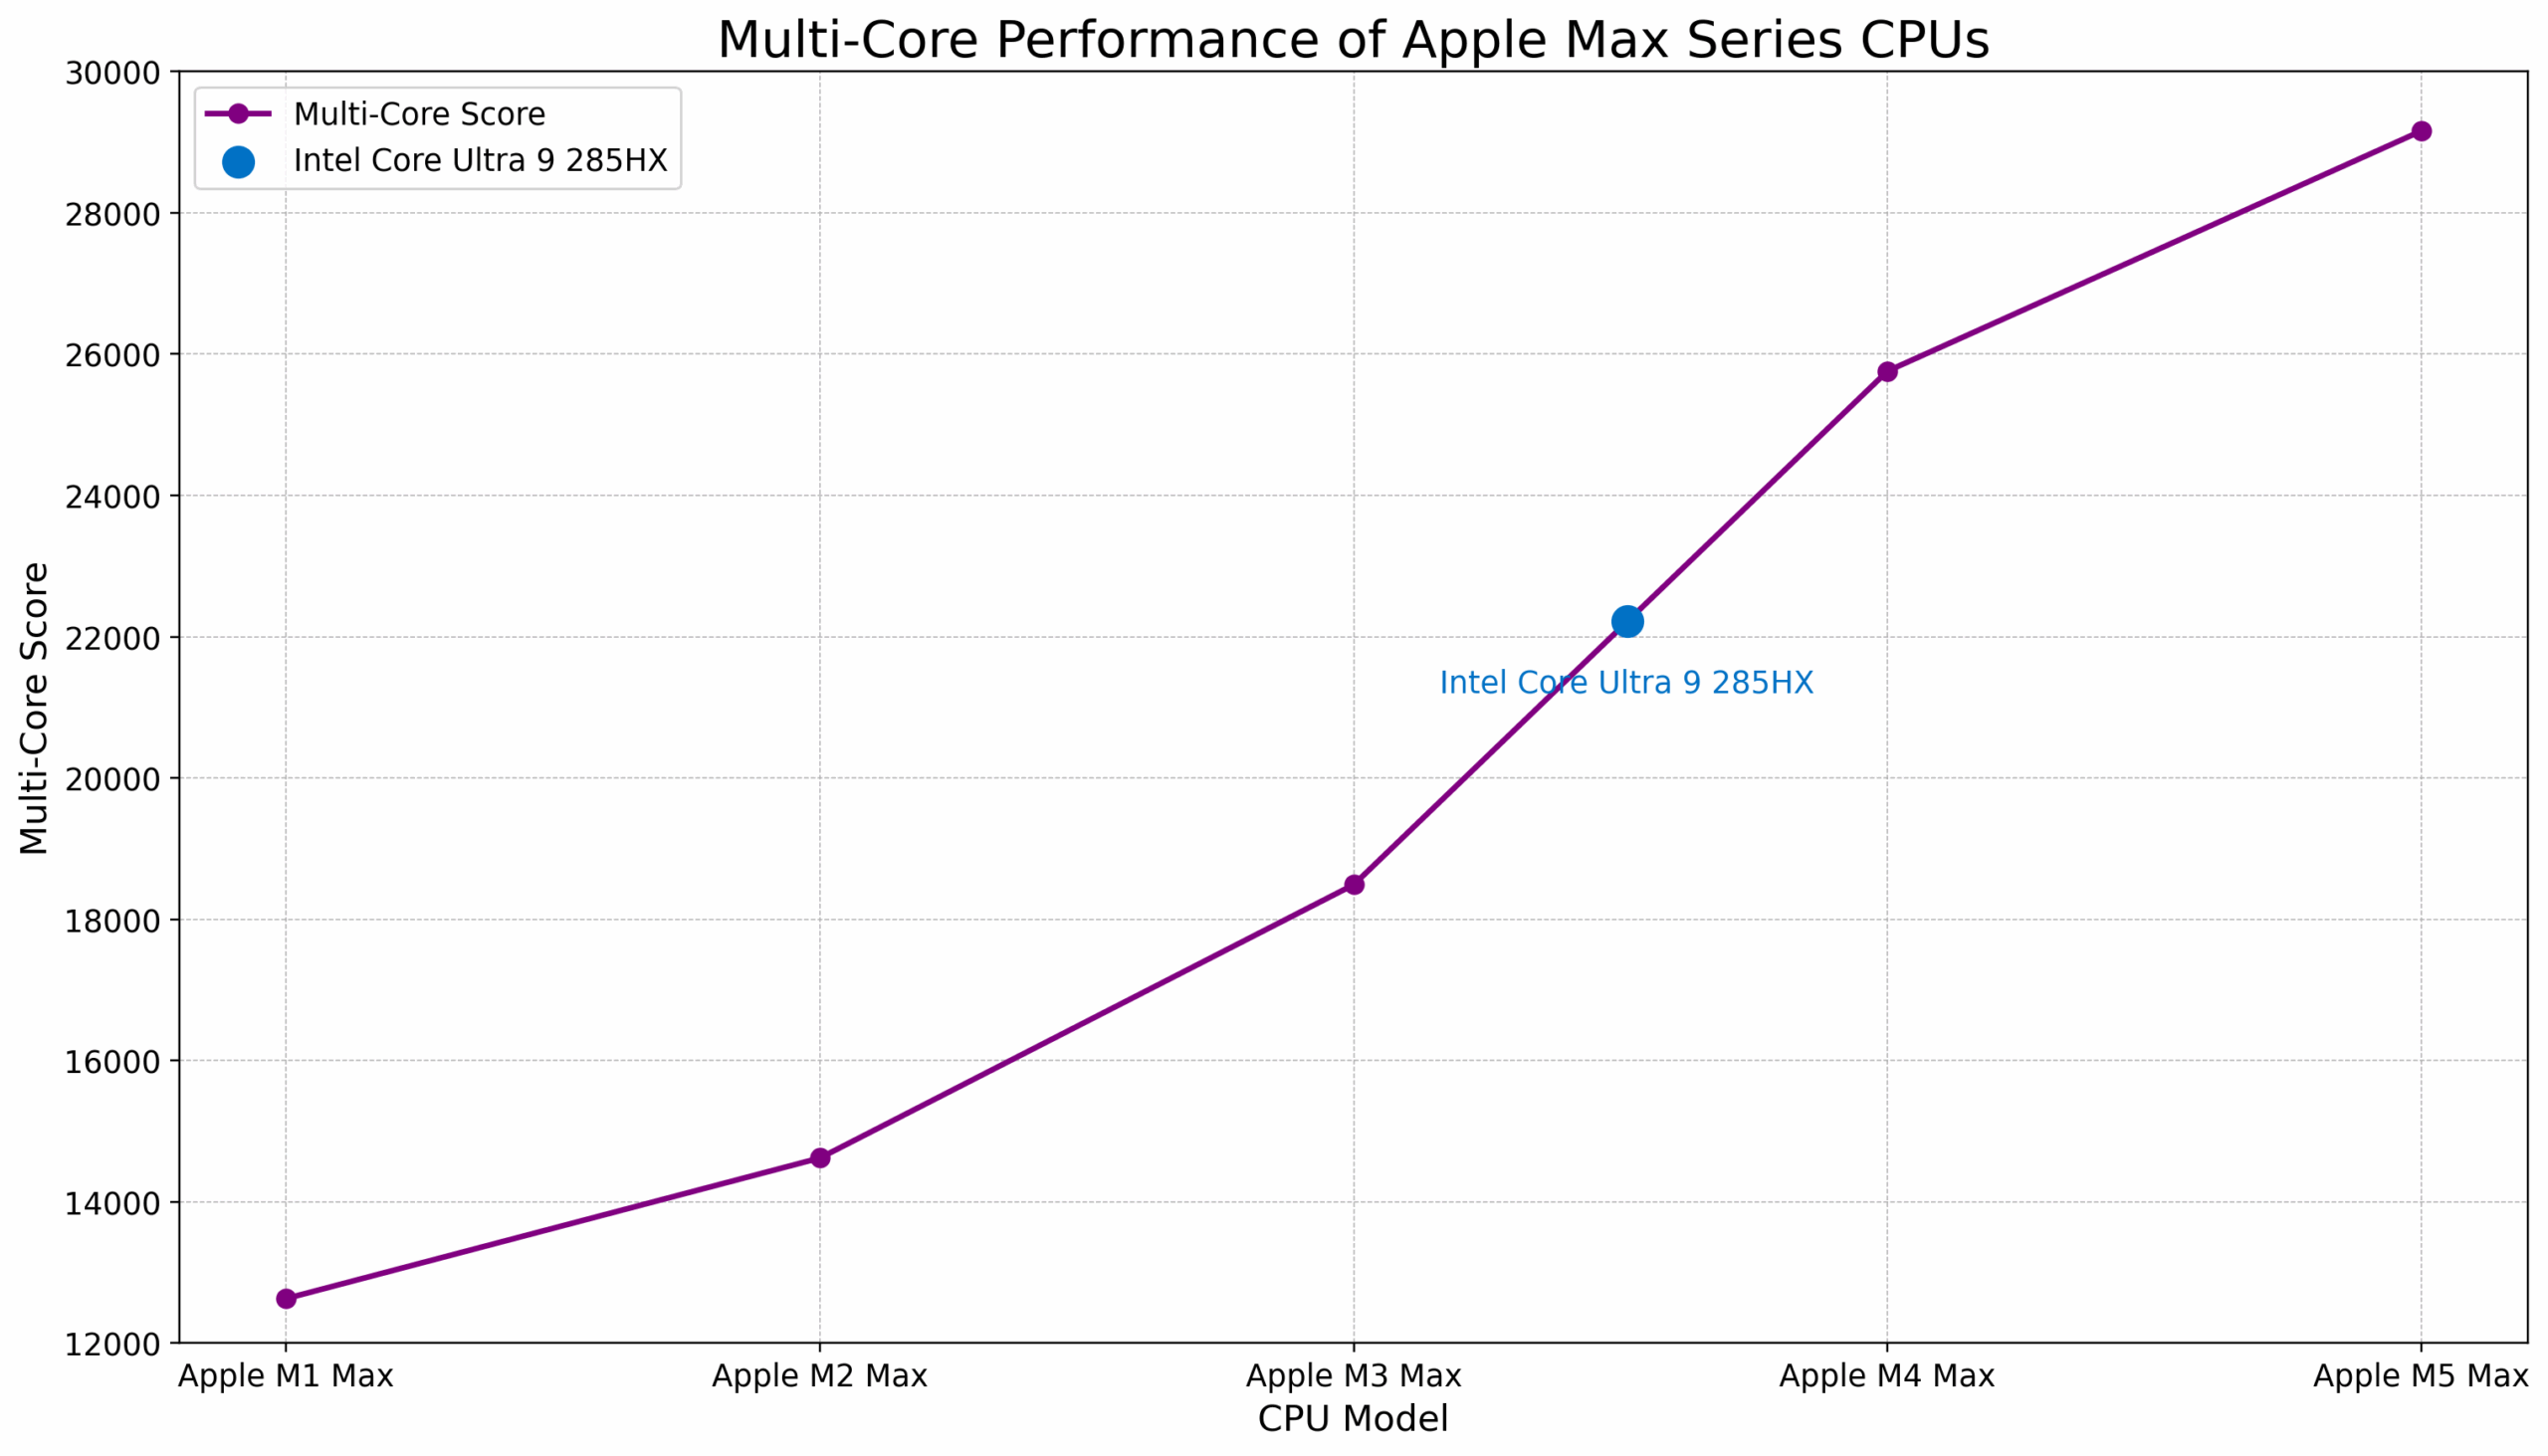
| CPU | Geekbench 6 多核 | 性能提升 (%) |
| 苹果 M1 Max(10 核 CPU) | 12 631 | |
| 苹果 M2 Max(12 核 CPU) | 14 621 | +16% |
| 苹果 M3 Max(14 核 CPU) | 18 490 | +26% |
| 苹果 M4 Max(16 核 CPU) | 25 760 | +39% |
| 苹果 M5 Max(18 核 CPU) | 29 159 | +13% |
| 平均性能提升24% | ||
苹果 M1 Ultra vs M2 Ultra vs M3 Ultra vs M4 Ultra 和 M5 Ultra(预测值)
编辑[03/2025]: 苹果 M3 Ultra 的发布时间比预期晚了很多,但它还是来了,而且是一个巨大的更新 – 性能提升 33%!这将 M4 Ultra 的预测值从 33 773 分提升至 37 867 分,而 M5 Ultra 的预测值则疯狂攀升至 42 864 分!
鉴于 Ultra 芯片通常用于台式机配置,我们将移动版英特尔酷睿 Ultra 9 285HX 与台式机旗舰英特尔酷睿 Ultra 9 285K 互换,后者在多核测试中的得分为 22000 分,比 M2 Ultra 快 4%。
因此,M4 Ultra 的速度有望比英特尔酷睿 Ultra 9 285K 快 72%,而 M5 Ultra 的速度可能是英特尔酷睿 Ultra 9 285K 的两倍。当然,这只是预测,苹果可能需要重新设计 Mac Studio,才能将 M4 Ultra 或 M5 Ultra 装入其中。
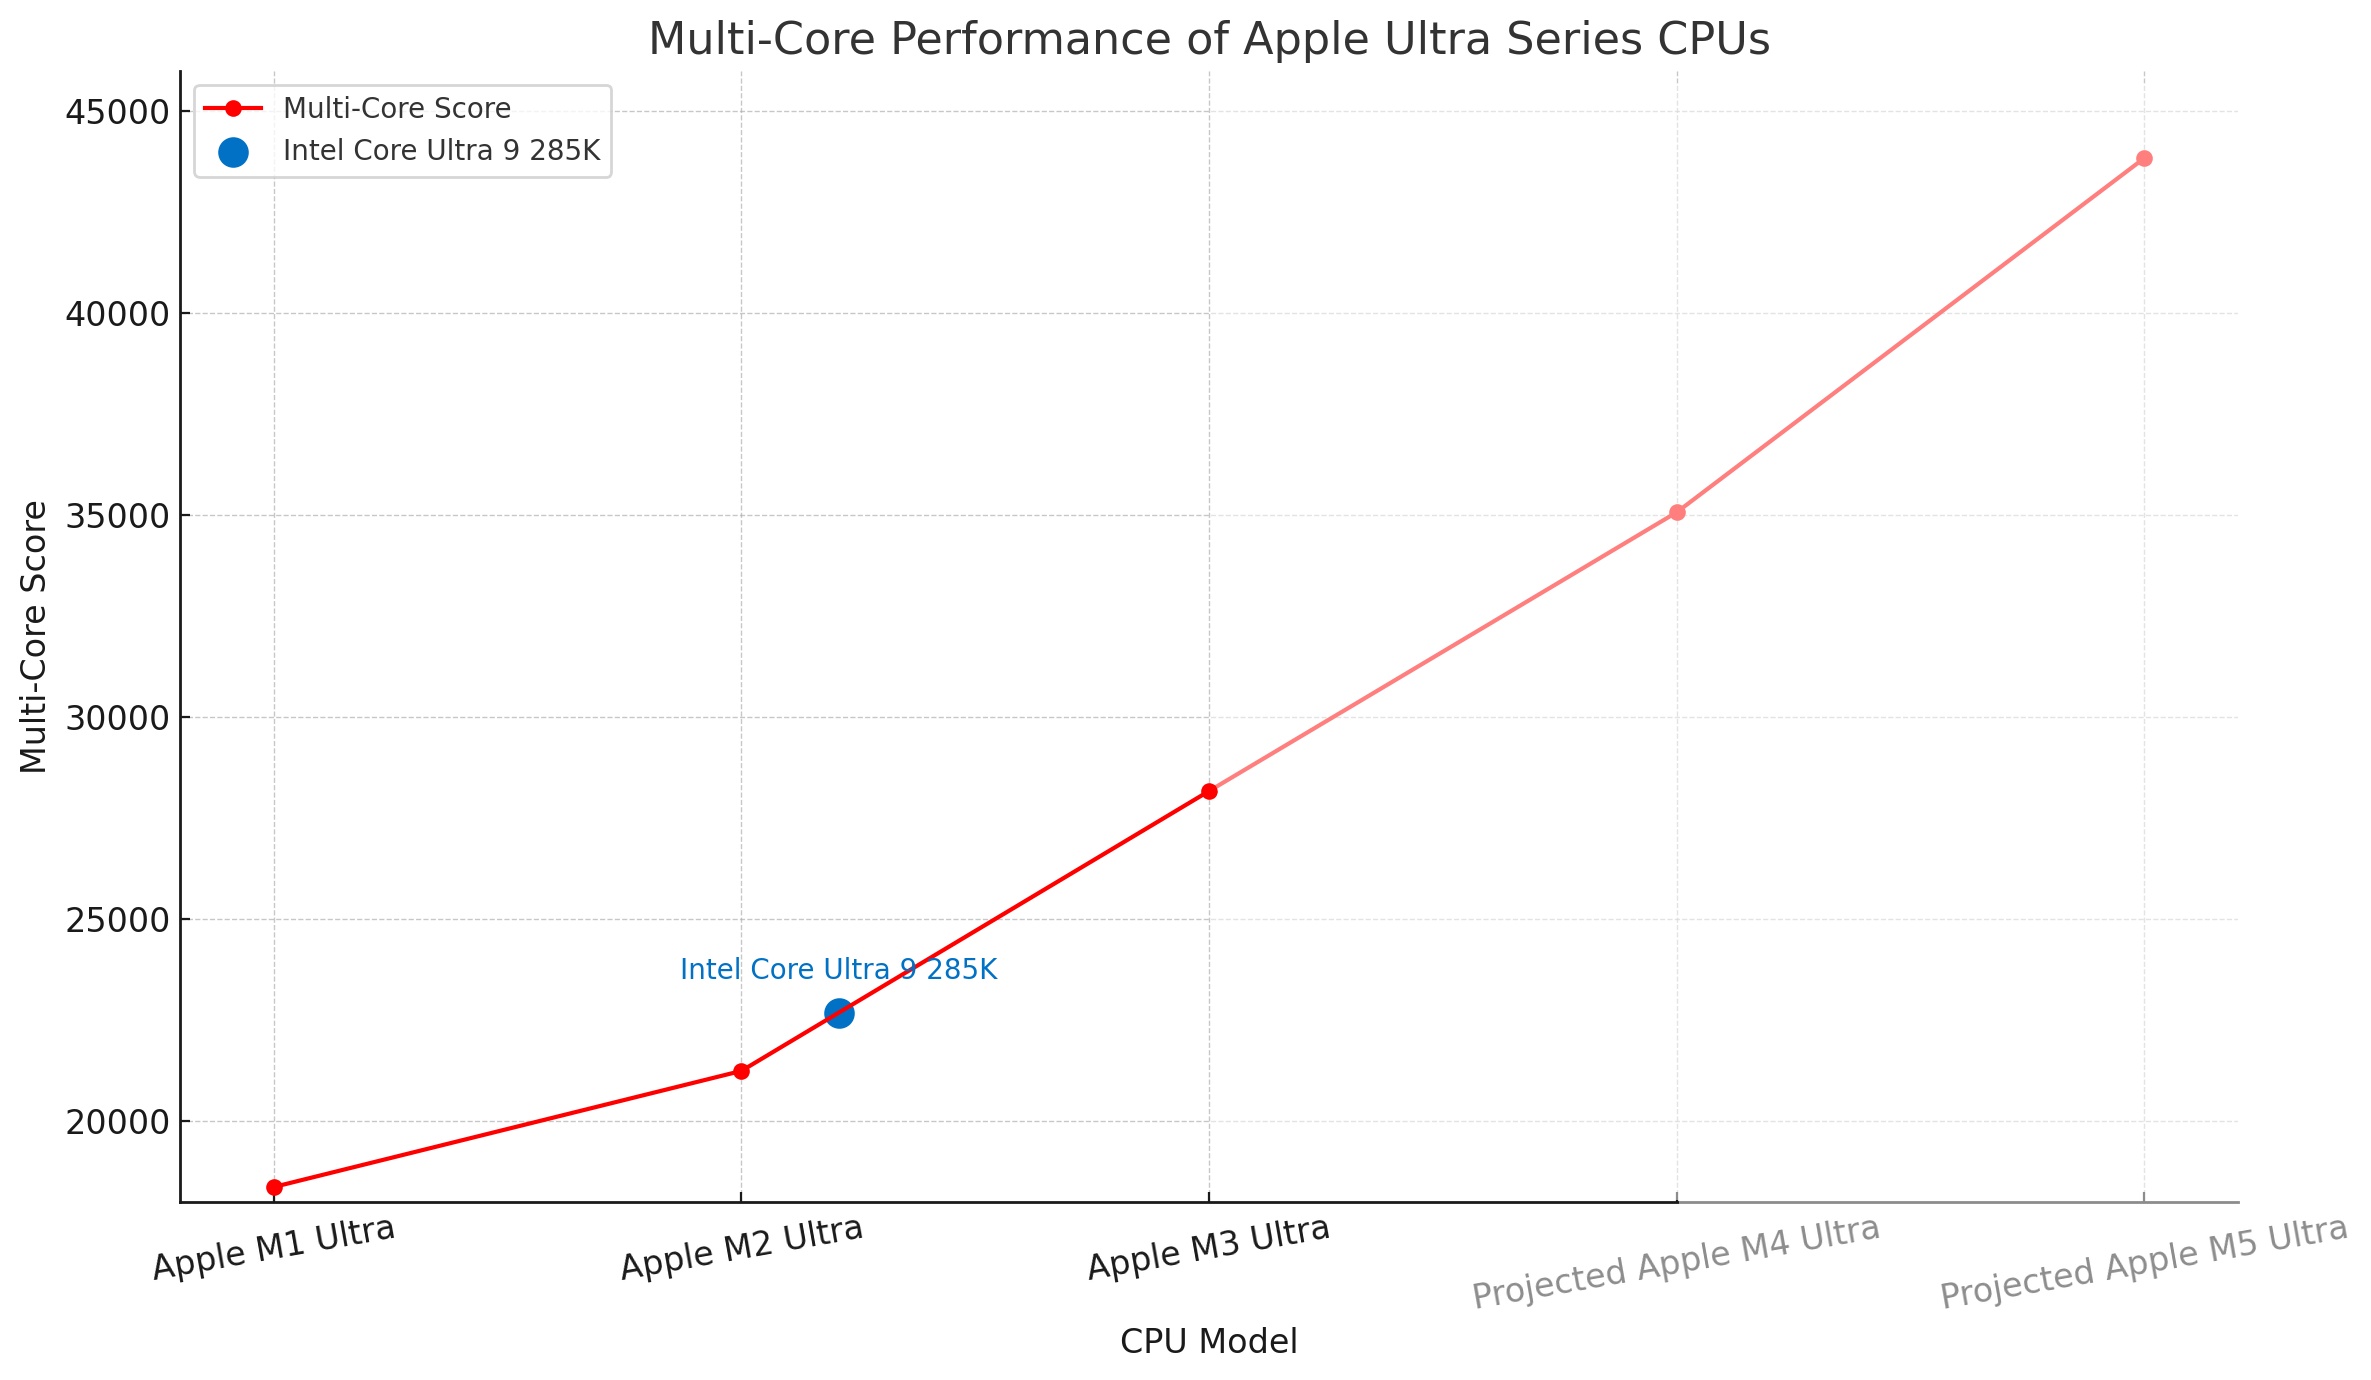
| 处理器 | Geekbench 6 多核 | 性能提升 (%) |
| Apple M1 Ultra | 18 367 | |
| 苹果 M2 Ultra | 21 241 | +16% |
| 苹果 M3 Ultra | 28 169 | +33% |
| 预计苹果 M4 Ultra | 37 867 | +34% |
| 预计苹果 M5 Ultra | 42 864 | +13% |
| 平均性能跃升25% | ||
终极对比
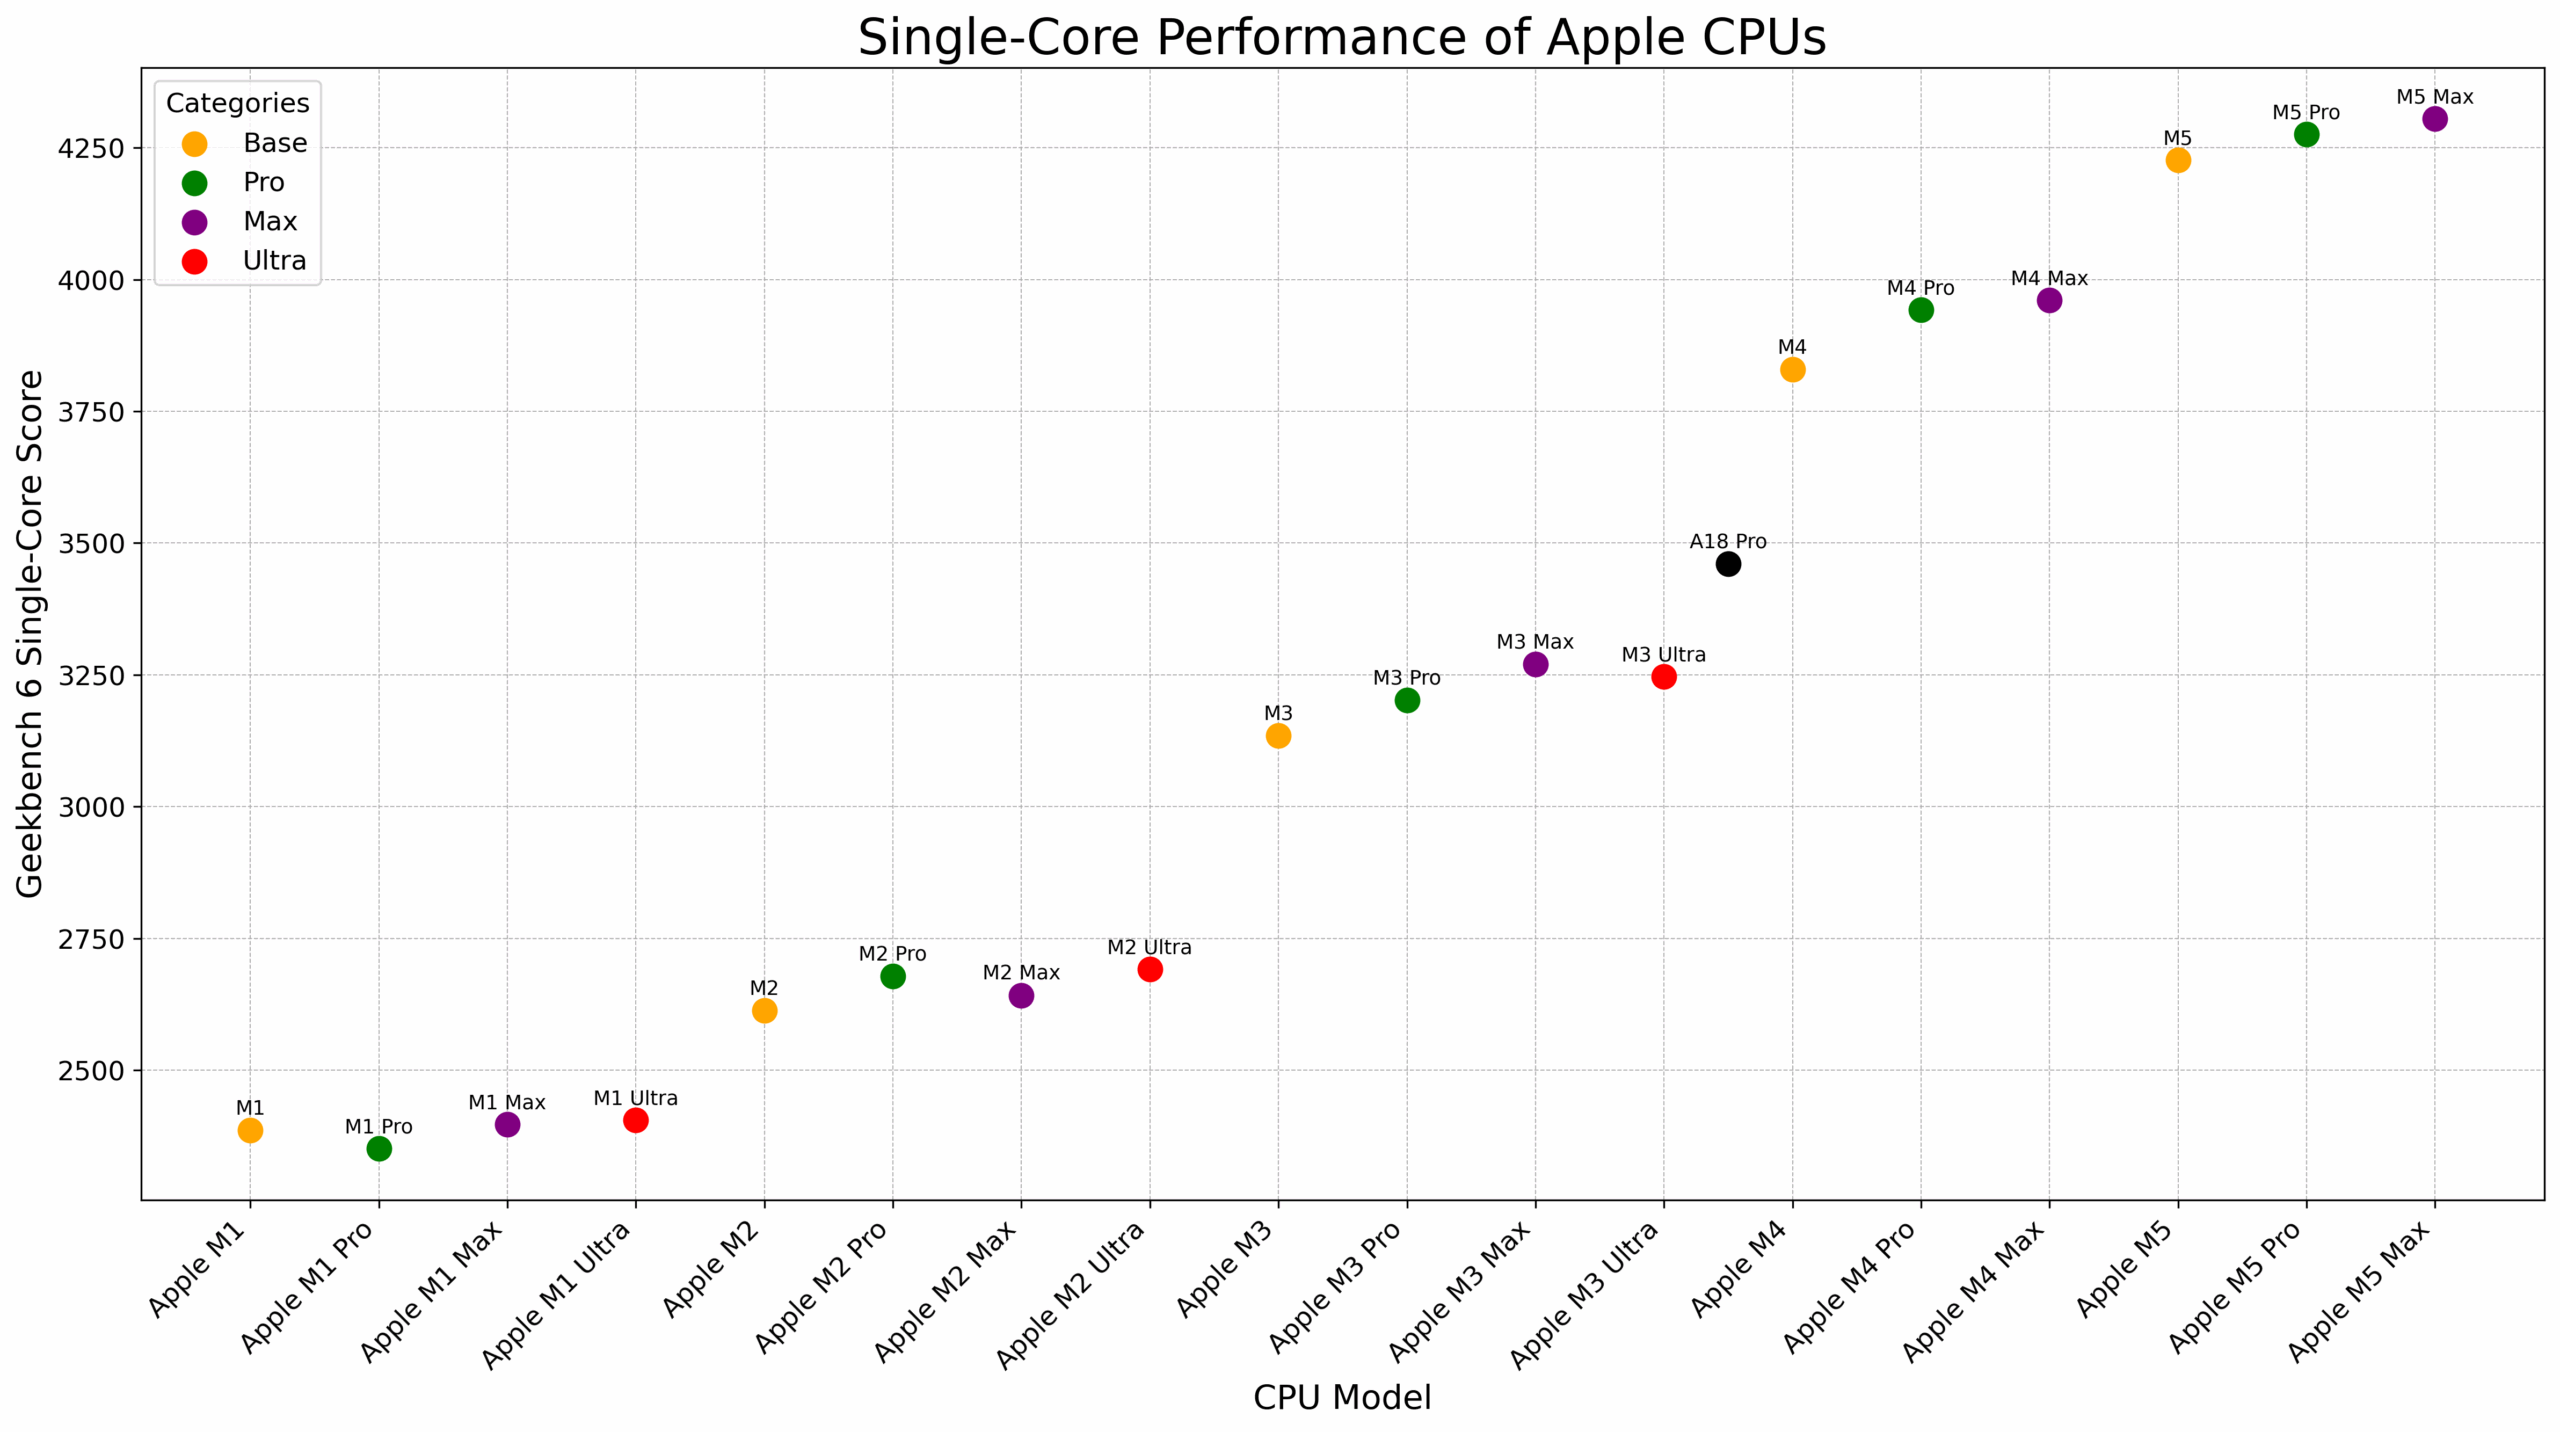
现在,让我们用实际数据对所有 Apple M 系列 CPU 进行全面比较。
最新的苹果 M5 处理器是单核性能最快的 CPU:
在处理繁重工作时,苹果 M5 的多核性能与较小的 M3 Max(14 核)类似,比 M4 Pro(12 核)低 14%。不过,M4 Max 拥有非凡的内存带宽(409.6 GB/s),是 M4(120 GB/s)的 3-4 倍,是 M2 Pro(204.8 GB/s)的 2 倍,这对人工智能项目大有裨益。AI 之王是苹果 M3 Ultra,多核分数高达 28,000+ ,内存带宽为 819.3 GB/s。
M5 Pro 变体的多核性能与 M3 Ultra 相当,而 M5 Max 则更加强大:
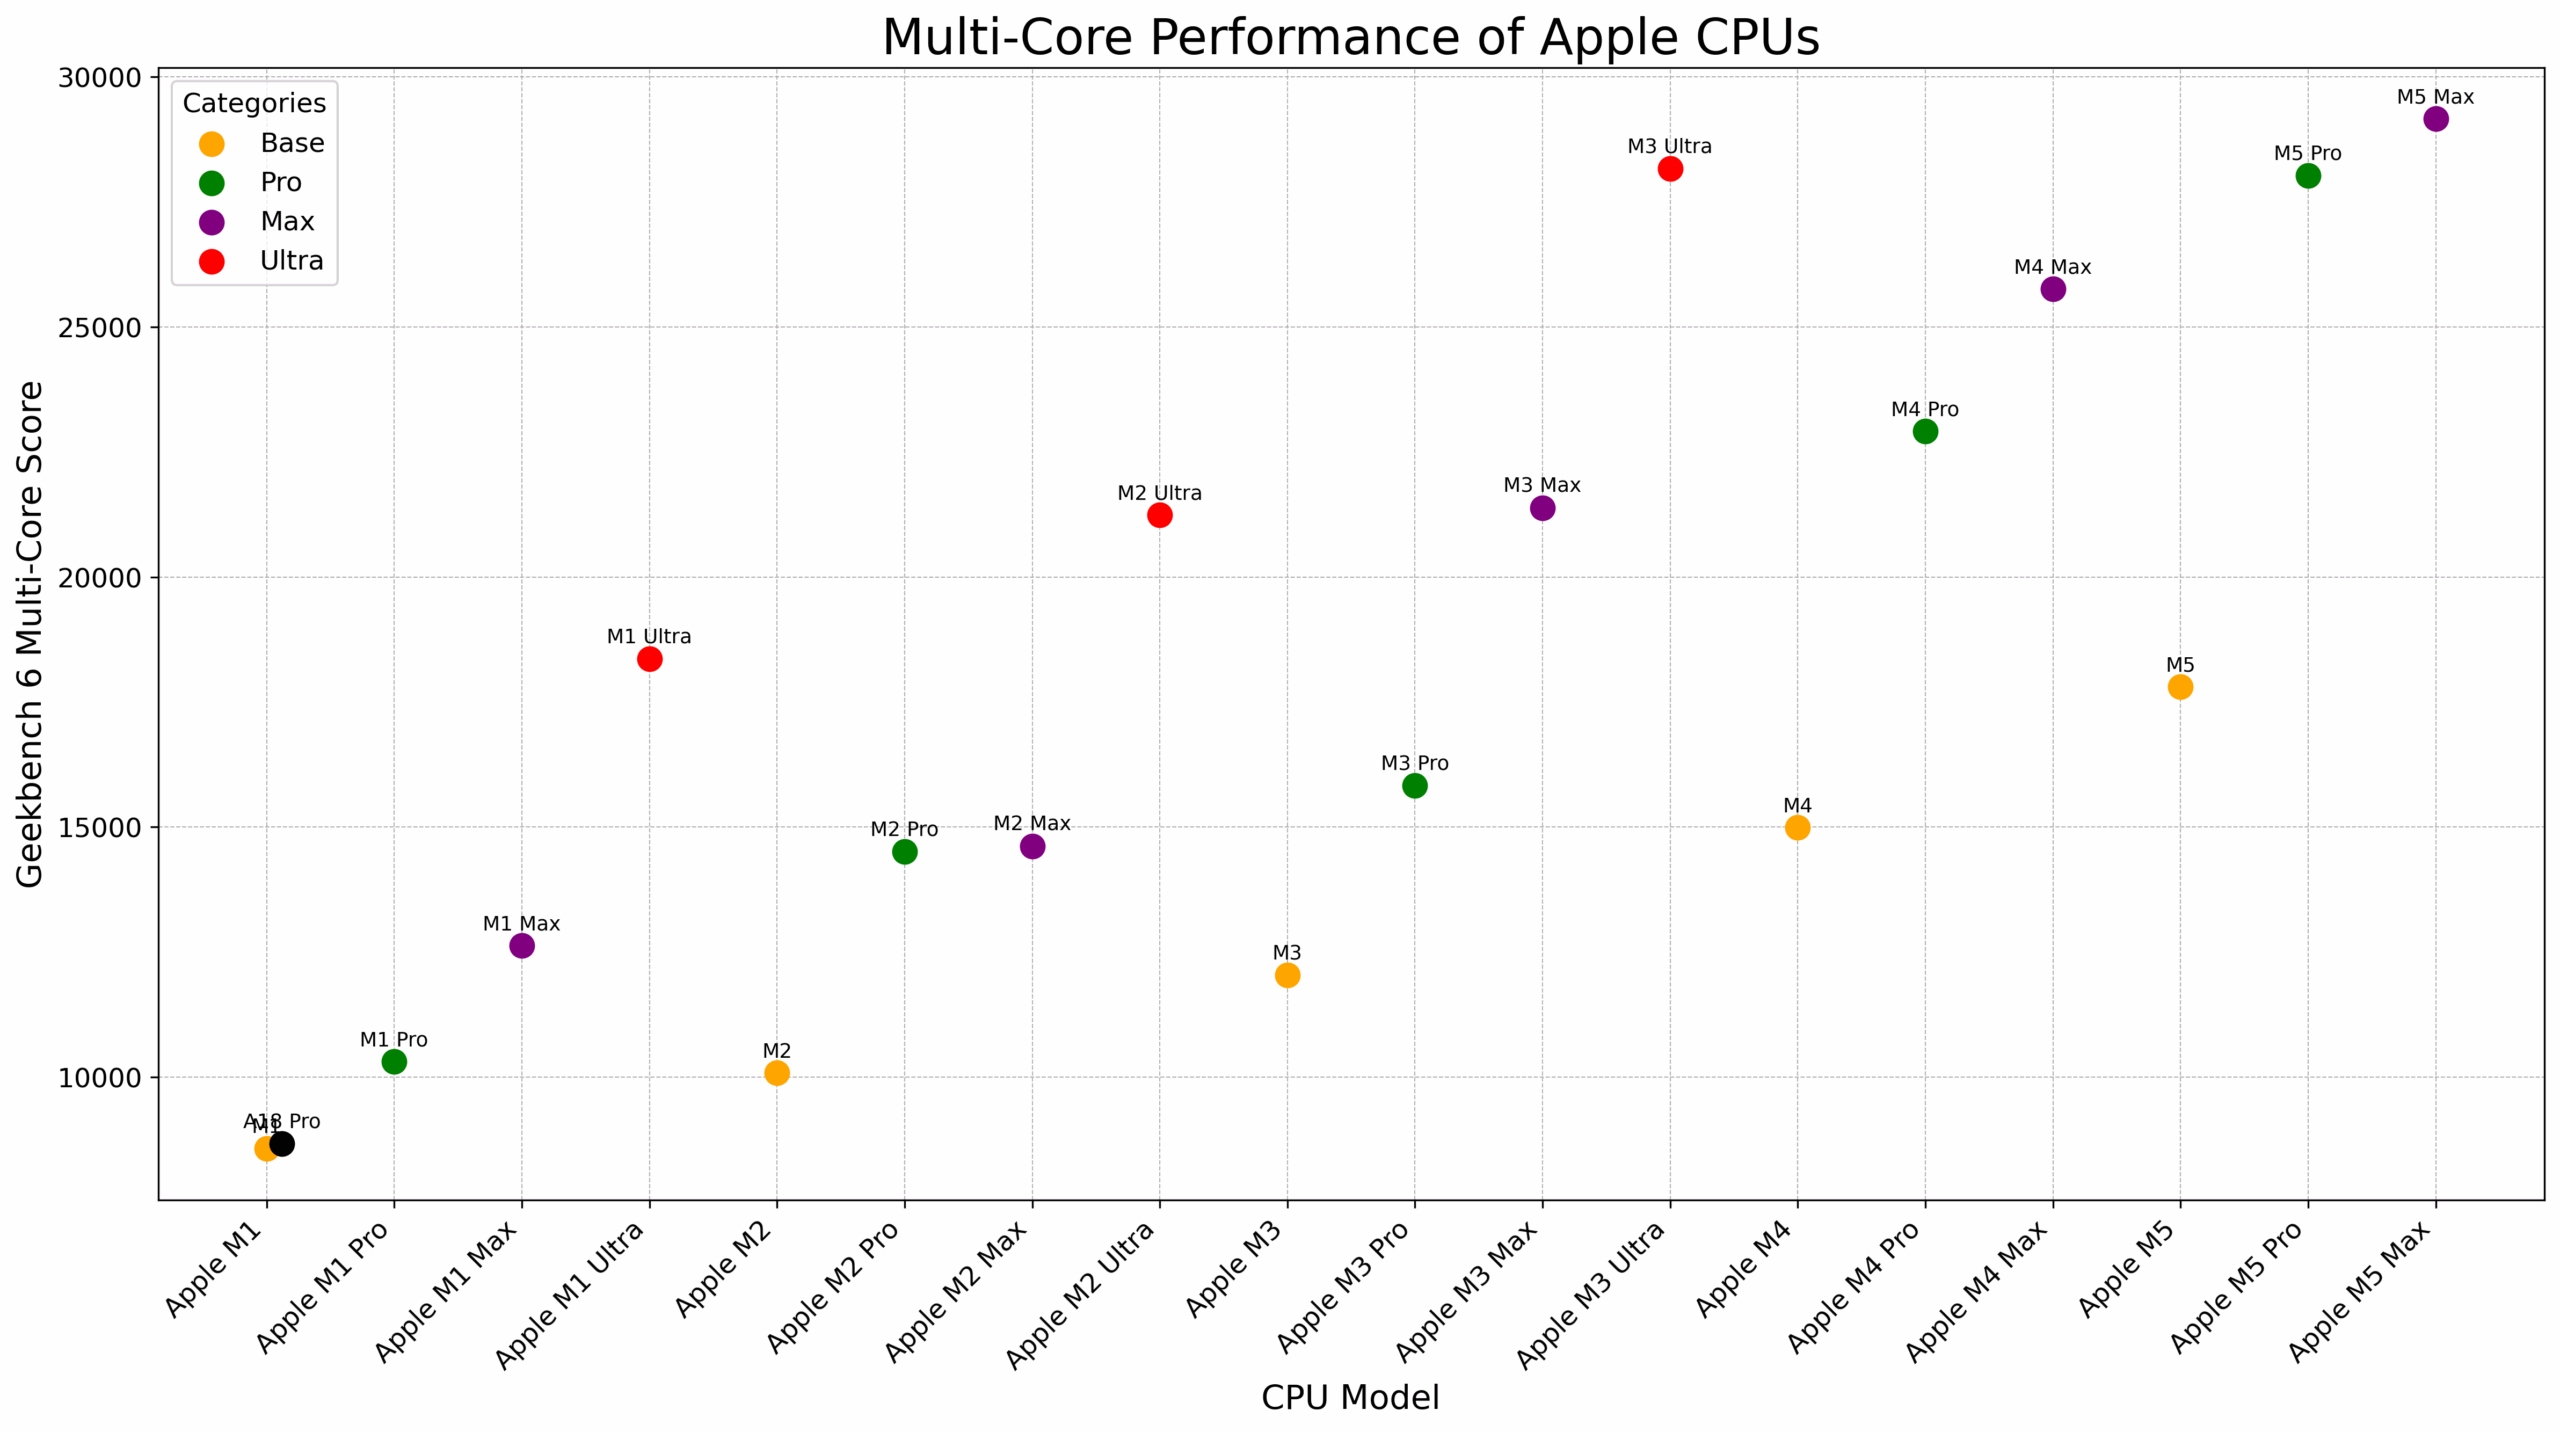
我们在上文仅重点介绍了性能最高的 CPU 变体,同一型号存在多个版本。以下是所有 M 系列处理器及其单核和多核分数的完整列表:
| CPU | 单核分数 | 多核分数 |
|---|---|---|
| 苹果 M5 Max(18 核 CPU) | 4305 | 29159 |
| Apple M5 Pro(18 核 CPU) | 4276 | 28030 |
| Apple M5 Pro(15 核 CPU) | 待定 | 待定 |
| 苹果 M5(10 核) | 4227 | 17802 |
| 苹果 M5(9 核) | 4103 | 15308 |
| 苹果 M4 Max(16 核) | 3880 | 25760 |
| 苹果 M4 Max (14 核) | 3961 | 22725 |
| 苹果 M4 Pro(14 核) | 3943 | 22914 |
| 苹果 M4 Pro(12 核) | 3922 | 20622 |
| 苹果 M4(10 核) | 3830 | 14990 |
| 苹果 M4(9 核) | 3671 | 13381 |
| 苹果 M4(8 核) | 3650 | 13836 |
| Apple M3 Ultra(32 核 CPU) | 3247 | 28169 |
| Apple M3 Ultra(28 核 CPU) | 3244 | 27091 |
| Apple M3 Max(16 核 CPU) | 3270 | 21385 |
| Apple M3 Max(14 核 CPU) | 3109 | 18490 |
| Apple M3 Pro(12 核 CPU) | 3202 | 15831 |
| Apple M3 Pro(11 核 CPU) | 3067 | 14453 |
| Apple M3(8 核 CPU) | 3135 | 12042 |
| Apple M2 Ultra(24 核 CPU) | 2691 | 21241 |
| Apple M2 Max(12 核 CPU) | 2642 | 14621 |
| Apple M2 Pro(12 核 CPU) | 2678 | 14511 |
| Apple M2 Pro(10 核 CPU) | 2590 | 11455 |
| Apple M2(8 核 CPU) | 2613 | 10082 |
| Apple M1 Ultra(20 核 CPU) | 2405 | 18367 |
| Apple M1 Max(10 核 CPU) | 2397 | 12631 |
| Apple M1 Pro(8 核 CPU) | 2351 | 10307 |
| Apple M1(8 核 CPU) | 2386 | 8571 |
希望本摘要能帮助您决定选择哪款 M 系列 CPU。
您可能还会对我们的其他分析感兴趣:
差距越来越大:苹果将英特尔甩在身后
当然,也不要错过我们与高通骁龙 X Elite 的比较:
苹果 M4 与骁龙 X 精英–下一代 CPU 之争
 Author: Simeon NikolovEditor-in-Chief at LaptopMedia.com with 20+ years of experience in testing and analyzing laptops and mobile devices.

![[August 2026] Amazon Italy: Top 10 Best-Selling Laptops – Apple MacBook Neo Claims the Crown as Budget and Mid-Range Windows Machines Dominate Volume](https://laptopmedia.com/wp-content/uploads/2026/09/Best-Selling-Laptops-IT-Top-10-400x225.jpg)
![[August 2026] Amazon Italy: Top 7 Best-Selling Gaming Laptops – ASUS V16 Claims the #1 Spot Amid Strong Mid-Range Demand](https://laptopmedia.com/wp-content/uploads/2026/09/Best-Selling-Gaming-Laptops-IT-Top-10-400x225.jpg)
![[August 2026] Best-Selling Laptop Brands on Amazon Italy – Lenovo Dominates Market Share and Revenue Leadership](https://laptopmedia.com/wp-content/uploads/2026/09/IT-Best-Brands-400x225.jpg)
![[August 2026] Amazon India: Top 10 Best-Selling Laptops – Apple MacBook Neo Dominates the Charts with Massive Sales Lead](https://laptopmedia.com/wp-content/uploads/2026/09/Best-Selling-Laptops-IN-Top-10-400x225.jpg)
![[August 2026] Amazon India: Top 10 Best-Selling Gaming Laptops – HP Victus 15 Dominates the Market with Massive Unit Lead](https://laptopmedia.com/wp-content/uploads/2026/09/Best-Selling-Gaming-Laptops-IN-Top-10-400x225.jpg)

这个文章总结的太棒了,什么神仙编辑,把我想要的信息都罗列出来了
这条评论真是太温暖了,让我非常开心!谢谢你,Yesir!
—
That was the most heartwarming comment; it made my day! Thank you, Yesir!
Best Apple M chips analysis
Thank you very much, wu wei!
赞 赞 赞 加鸡腿
🙂 👍
incredible comparison design. any chance for gpu/npu?
Good idea!
Great article, would love to see update with GPU performance gain comparsion too
Perfect analysis. There are all I want to get!
Hello, I don’t get the comparison with i9-14900K .. it’s just purposely written and depicted to make apple chips better … In reality i9 cpu that was used as a reference point is on the top of the list
Check this out, bro, https://versus.com/en/intel-core-i9-14900hx-vs-intel-core-i9-14900k
I had a look at your chart which does not include the M5 and the graphs above are accurate.
The i9-14900K only beats the lower spec Apple chips at multi core performance and Cinebench. It trails everywhere else.
You seem to be going off the Crossmark Overall score which is distorted by the large number of No Value results for the Apple chips because some of the tests do not run on the Macs.
I had a look at your chart which does not include the M5 and the graphs above are accurate.
The i9-14900K only beats the lower spec Apple chips at multi core performance and Cinebench. It trails everywhere else.
You seem to be going off the Crossmark Overall score which is distorted by the large number of No Value results for the Apple chips because some of the tests do not run on the Macs.
Great effort for putting together such an extensive comparison. I only wish the Y-axis started at zero because at the moment, you’ve artificially amplified the true relative difference between all of them.
Thank you, WFR! While a zero-start axis is indeed the safest choice for showing absolute performance, my goal here was slightly different. I wanted to highlight the relative uplift between generations, using the M1 (2020) as a baseline, so readers can quickly judge “how big is the jump from what I have to what I’m considering” (with the added context of Intel CPUs as well). I initially tried charts starting at zero, but the bars became compressed and the differences between closer generations were much harder to read at a glance. For example, if you’re on M4 and mostly care… 阅读更多 »
You do not show the relative uplift if you chop off the lower part of the graph.
For relative values you HAVE to show the whole enchalada, not the clipped M4 minus M1 which make the M1 zero value.
The % uplift you show in the figures actually works off the WHOLE value not a clipped value.
It would be great to have all M series Apple silicon GPU benchmarks.
每次都看这个总结,各种对比数据太清晰了,期待m5pro和max的加入,感谢你的付出
Thank you! The new models are coming to our lab, stay tuned for full analysis and reviews!
—-
谢谢!新模型即将送达我们的实验室,敬请期待完整的分析和评测!
Amazing! I was just about to do a spreadsheet on exactly this and found this site immediately. Thanks for the great work. 😃👏 All that’s missing is a “Bangs for Bucks chart” with the performance rated against price for each model. Just one suggestion. The Charts are too big for the information. If they were smaller you could take in all the information withouy scrolling. You should always start charts them from zero clipping them does not show the correct relativity. For the pricing I’d tilt the charts to axonometric view with $ as the height off the chart. We… 阅读更多 »
It would be even better if there were a graphics performance rating.
This is the most detailed and best article I have ever seen! This has provided me with great help in choosing m chips. Thank you so much!