Apple M5 vs M4, M3, M2, M1 (+Pro/Max/Ultra): Vollständiger Vergleich!
Apple hat seine CPUs der M-Serie so konzipiert, dass sie wie Legosteine funktionieren und sich so zu noch leistungsfähigeren Chips zusammensetzen lassen. So sind die M-Ultra-Chips im Wesentlichen zwei M-Max-CPUs, die ihre Ressourcen effektiv verdoppeln und es mit jeder Intel- und AMD-CPU aufnehmen können. Heute geht es jedoch nicht um Team Blue und Team Red, sondern um den Vergleich aller vier Generationen von M-Serien-Prozessoren.
Außerdem werden wir die voraussichtlichen Ergebnisse für den Apple M5 Pro, M5 Max und M5 Ultra und natürlich für den fehlenden M4 Ultra präsentieren. Los geht’s!
[01/2025] Aktualisiert: Apple M4 (8-Core-CPU), M4 (10-Core-CPU), M4 Pro (12-Core-CPU), M4 Pro (14-Core-CPU), M4 Max (14-Core-CPU) und M4 Max (16-Core-CPU) hinzugefügt
[03/2025] Aktualisiert: Apple M3 Ultra hinzugefügt
[11/2025] Aktualisiert: Apple M5 (9-Kern und 10-Kern) hinzugefügt
[03/2026] Aktualisiert: A18 Pro, Apple M5 Pro (15-Kern und 18-Kern) und Apple M5 Max hinzugefügt
Apple CPU-Reihe – Die vollständige Liste
Jede neue Generation von Apple Chips bringt bedeutende Upgrades mit sich, da Apple jedes Jahr leistungsfähigere und effizientere Architekturen einführt:
| Apple SoC | Super / Leistung / Effizienz Kerne | GPU-Kerne | Speicher Bandbreite | Transistoren |
| Apple M5 Max (18-Kern-CPU, 40c-GPU) | 6S+12P | 40 | 614 GB/s | – |
| Apple M5 Max (18-Kern-CPU, 32c-GPU) | 6S+12P | 32 | 460 GB/s | – |
| Apple M5 Pro (18-Kern-CPU) | 6S+12P | 20 | 307 GB/s | – |
| Apple M5 Pro (15-Kern-CPU) | 5S+10P | 16 | 307 GB/s | – |
| Apple M5 (10-Kern-CPU) | 4P+6E | 10 | 153 GB/s | – |
| Apple A18 Pro (MacBook Neo) | 2P+4E | 5 | 60 GB/s | – |
| Apple M5 (9-Kern-CPU) | 3P+6E | 10 | 153 GB/s | – |
| Apple M4 Max (16-Kern-CPU) | 12P+4E | 40 | 546 GB/s | – |
| Apple M4 Max (14-Kern-CPU) | 10P+4E | 32 | 410 GB/s | – |
| Apple M4 Pro (14-Kern-CPU) | 10P+4E | 20 | 273 GB/s | – |
| Apple M4 Pro (12-Kern-CPU) | 8P+4E | 16 | 273 GB/s | – |
| Apple M4 (10-Kern-CPU) | 4P+6E | 10 | 120 GB/s | 28 Milliarden |
| Apple M4 (9-Kern-CPU) | 3P+6E | 8 | 120 GB/s | 28 Milliarden |
| Apple M4 (8-Kern-CPU) | 4P+4E | 8 | 120 GB/s | 28 Milliarden |
| Apple M3 Ultra (32-Kern-CPU) | 24P+8E | 80 | 819,3 GB/s | 184 Milliarden |
| Apple M3 Ultra (28-Kern-CPU) | 20P+8E | 60 | 819,3 GB/s | 184 Milliarden |
| Apple M3 Max (16-Kern-CPU) | 12P+4E | 30 oder 40 | 408,6 GB/s | 92 Milliarden |
| Apple M3 Max (14-Kern-CPU) | 10P+4E | 30 oder 40 | 307,2 GB/s | 92 Milliarden |
| Apple M3 Pro (12-Kern-CPU) | 6P+6E | 14 oder 16 | 153,6 GB/s | 37 Milliarden |
| Apple M3 Pro (11-Kern-CPU) | 5P+6E | 14 oder 16 | 153,6 GB/s | 37 Milliarden |
| Apple M3 (8-Kern-CPU) | 4P+4E | 8 oder 10 | 102,4 GB/s | 25 Milliarden |
| Apple M2 Ultra (24-Kern-CPU) | 16P+8E | 60 oder 76 | 819,2 GB/s | 134 Milliarden |
| Apple M2 Max (12-Kern-CPU) | 8P+4E | 30 oder 38 | 409,6 GB/s | 67 Milliarden |
| Apple M2 Pro (12-Kern-CPU) | 6P+4E | 16 oder 19 | 204,8 GB/s | 40 Milliarden |
| Apple M2 Pro (10-Kern-CPU) | 6P+4E | 16 oder 19 | 204,8 GB/s | 40 Milliarden |
| Apple M2 (8-Kern-CPU) | 4P+4E | 8 oder 10 | 102,4 GB/s | 20 Milliarden |
| Apple M1 Ultra (20-Kern-CPU) | 16P+4E | 64 | 819,2 GB/s | 114 Milliarden |
| Apple M1 Max (10-Kern-CPU) | 8P+2E | 24 oder 32 | 409,6 GB/s | 57 Milliarden |
| Apple M1 Pro (10-Kern-CPU) | 8P+2E | 16 | 204,8 GB/s | 33,7 Milliarden |
| Apple M1 Pro (8-Kern-CPU) | 6P+2E | 14 | 204,8 GB/s | 33,7 Milliarden |
| Apple M1 (8-Kern-CPU) | 4P+4E | 7 oder 8 | 68,3 GB/s | 16 Milliarden |
Apple M1 vs. M2 vs. M3 vs. M4 vs. M5
Betrachten wir zunächst die Entwicklung der “Basis”-Variante der CPUs der M-Reihe.
Nachfolgend finden Sie eine Zusammenfassung der Single-Core-Leistung dieser Basisvarianten, die die Leistungswerte und prozentualen Verbesserungen über die verschiedenen Generationen hinweg aufzeigt.
Single-Core-Leistung
Die Single-Core-Leistung ist entscheidend für die optimale Geschwindigkeit von Anwendungen, die stark von der Kerngeschwindigkeit des Prozessors abhängen, wie Spiele oder Softwarekompilierung. Sie spielt auch eine wichtige Rolle bei der Bestimmung der allgemeinen Reaktionsfähigkeit und Effizienz von Betriebssystemen und Dienstprogrammen und gewährleistet ein reibungsloses Benutzererlebnis, selbst wenn keine Multi-Core-Optimierung verfügbar ist.
Als Referenz fügen wir den leistungsstärksten Intel-Chip in unserem Top-Laptop-CPU-Ranking hinzu, den Intel Core Ultra 9 285HX (3124 Punkte). Er stimmt fast perfekt mit dem Apple M3 überein. Der Apple A18 Pro im MacBook Neo liegt genau zwischen M3 und M4.
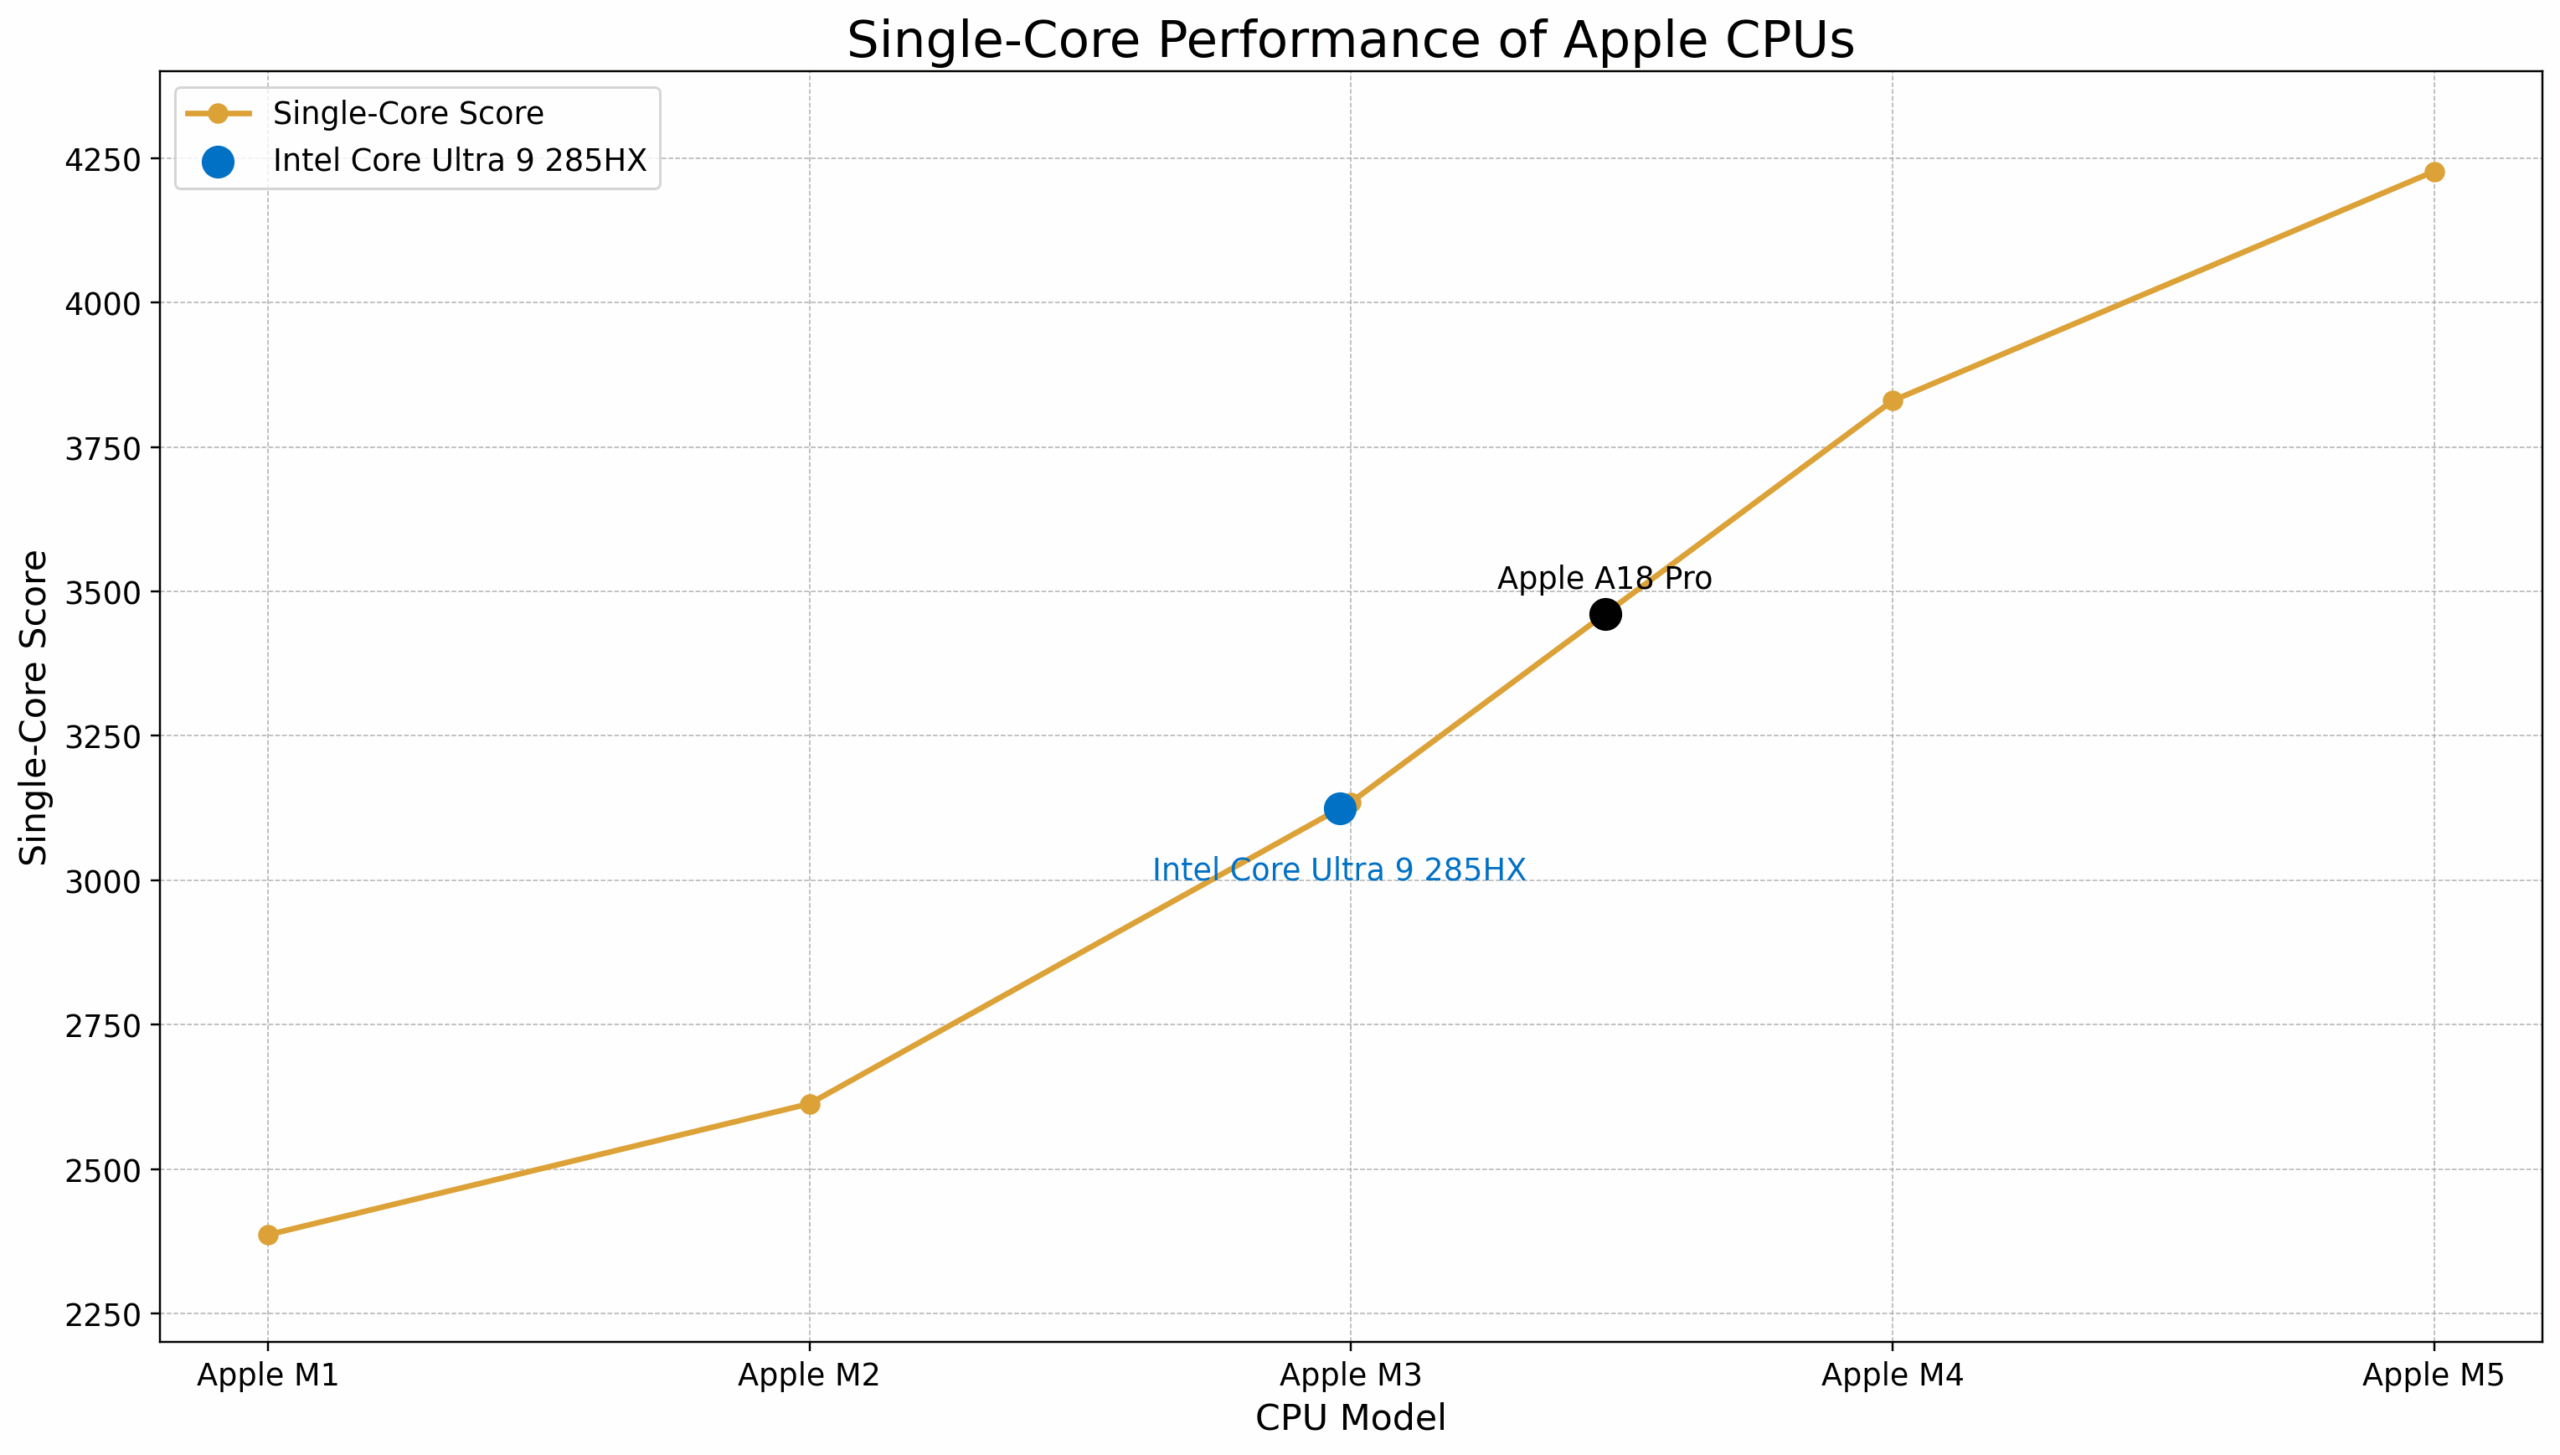
| CPU | Geekbench 6 Single-Core | Leistungssprung (%) |
| Apple M1 | 2386 | – |
| Apple M2 | 2613 | +10% |
| Apfel M3 | 3135 | +20% |
| Apple A18 Pro (MacBook Neo) | 3461 | – |
| Apple M4 | 3830 | +22% |
| Apfel M5 | 4227 | +10% |
| Durchschnittlicher Leistungssprung: +16% | ||
Der Apple M4 stellt den bisher größten Sprung in der Single-Core-Leistung dar.
Es gibt auch zwei “abgespeckte” Varianten des M4 – den Apple M4 mit 8 Kernen, der im günstigsten iMac zu finden ist, und den Apple M4 mit 9 Kernen, der im günstigsten iPad Pro zu finden ist:
| CPU | Geekbench 6 Single-Core | Leistungssprung (%) |
| Apple M4 (8-Kern, iMac) | 3650 | |
| Apple M4 (9-Kern, iPad) | 3671 | +0.5% |
| Apple M4 (10-Kern, MacBook Pro) | 3830 | +4% |
Multi-Core Leistung
Multi-Core-Leistung ist für die Bewältigung komplexer und anspruchsvoller Aufgaben wie Videobearbeitung, 3D-Rendering und wissenschaftliche Simulationen unerlässlich.
Die folgende Tabelle zeigt die Multi-Core-Leistung der Basis-CPUs der M-Serie von Apple und hebt die Verbesserungen und Leistungssteigerungen mit jeder neuen Generation hervor. Zur Veranschaulichung haben wir den leistungsstärksten Intel Chip in unserem Top-Laptop-CPU-Ranking hinzugefügt, den Intel Core Ultra 9 285HX, der 22215 Punkte erreicht.
Der Apple A18 Pro im MacBook Neo liegt knapp über dem Apple M1 Chip.
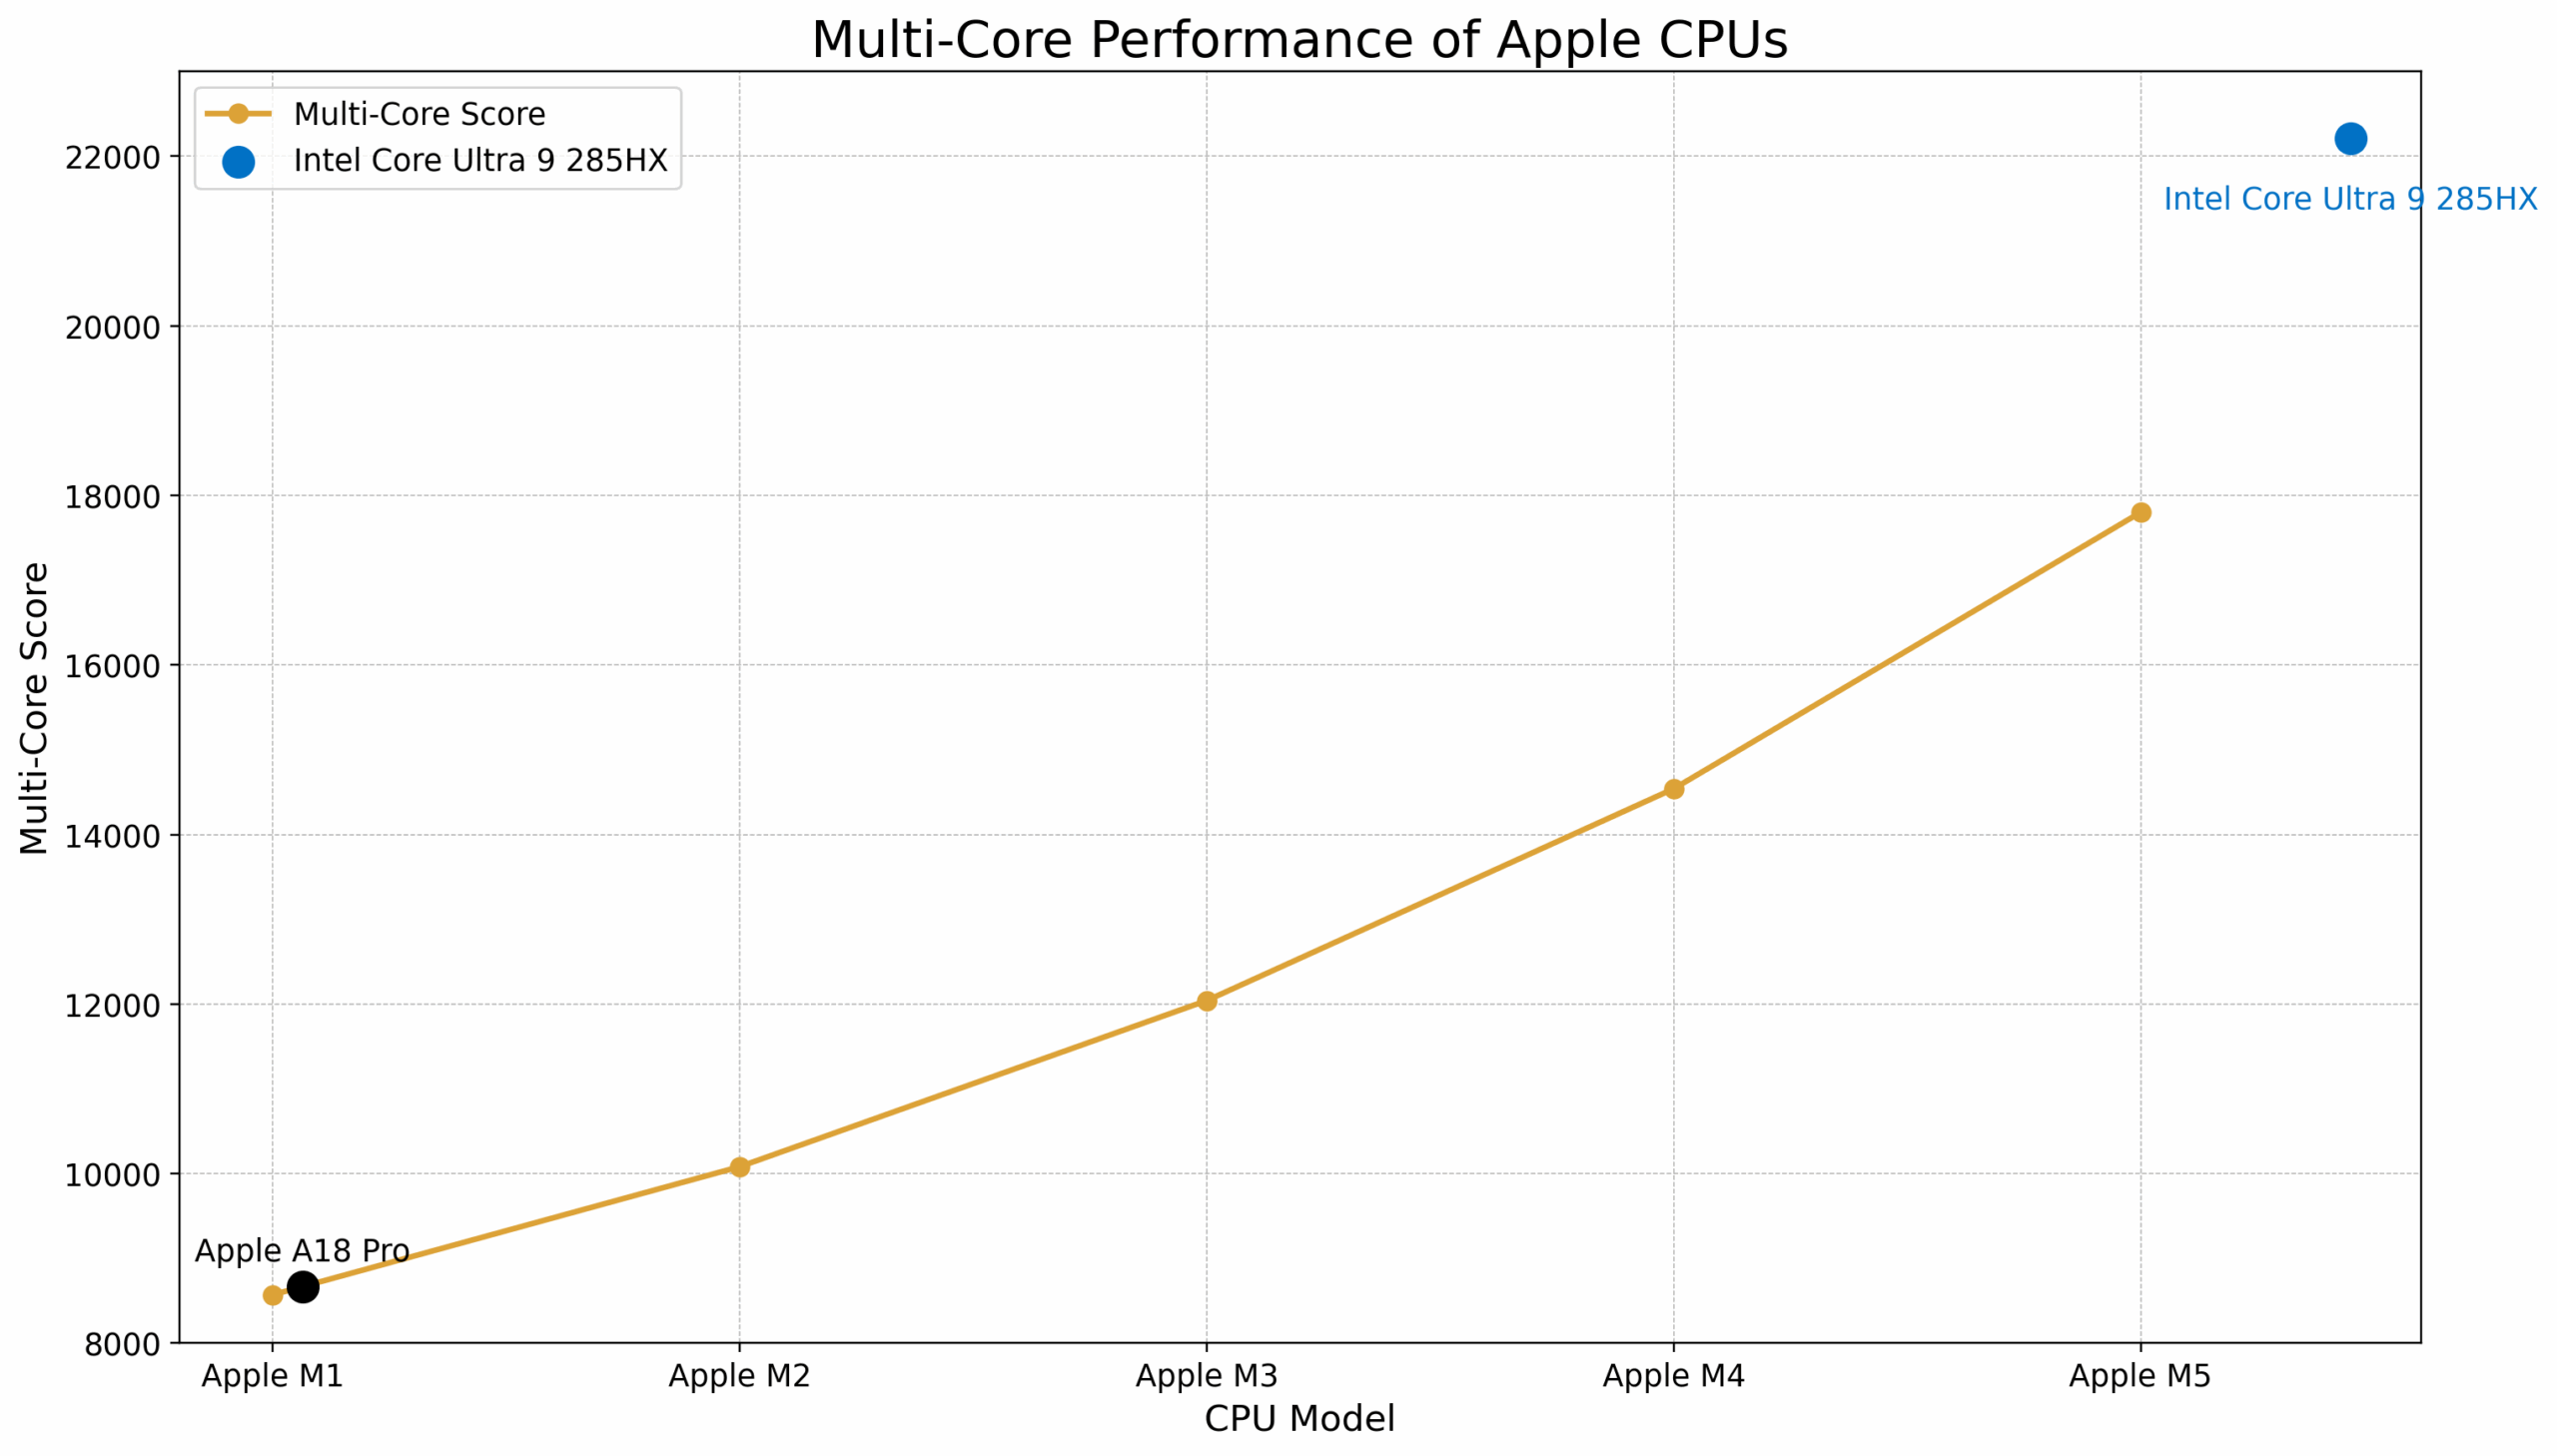
| CPU | Geekbench 6 Multi-Core | Leistungssprung (%) |
| Apple M1 | 8571 | – |
| Apple A18 Pro (MacBook Neo) | 8668 | – |
| Apple M2 | 10082 | +18% |
| Apfel M3 | 12042 | +19% |
| Apfel M4 | 14541 | +21% |
| Apfel M5 | 17802 | +22% |
| Durchschnittlicher Leistungssprung: +20% | ||
Die Entwicklung der Multi-Core-Leistung verläuft parallel zu den Verbesserungen bei den Single-Core-Prozessoren, wobei der neueste M5-Prozessor den größten Fortschritt darstellt. Allerdings bleiben die Basisvarianten bei komplexen Aufgaben immer noch hinter dem Intel-Flaggschiff Core Ultra 9 285HX zurück.
Hier ist noch einmal ein Vergleich der M4-Varianten:
| CPU | Leistung Kerne | Geekbench 6 Multi-Core | Leistungssprung (%) |
| Apple M4 (9 Kerne, iPad) | 3 | 13 381 | |
| Apple M4 (8 Kerne, iMac) | 4 | 13 836 | +3% |
| Apple M4 (10 Kerne, MacBook Pro) | 4 | 14 990 | +8% |
Vergleichen wir dies nun mit den Pro-, Max- und Ultra-Varianten der Apple M-Serie.
Apple M1 Pro vs. M2 Pro vs. M3 Pro vs. M4 Pro vs. M5 Pro
Der M4 Pro mit 14 Kernen verfügt über 10 leistungsstarke Kerne, die einen verrückten Leistungssprung von 45 % liefern! Das sind 3 % mehr als bei Intels mobilem Flaggschiff Intel Core Ultra 9 285HX. Im Grunde ist der Ultra 9 285HX also ungefähr so schnell wie der Apple M3 im Single-Core-Betrieb und wie der Apple M4 Pro im Multi-Core-Betrieb.
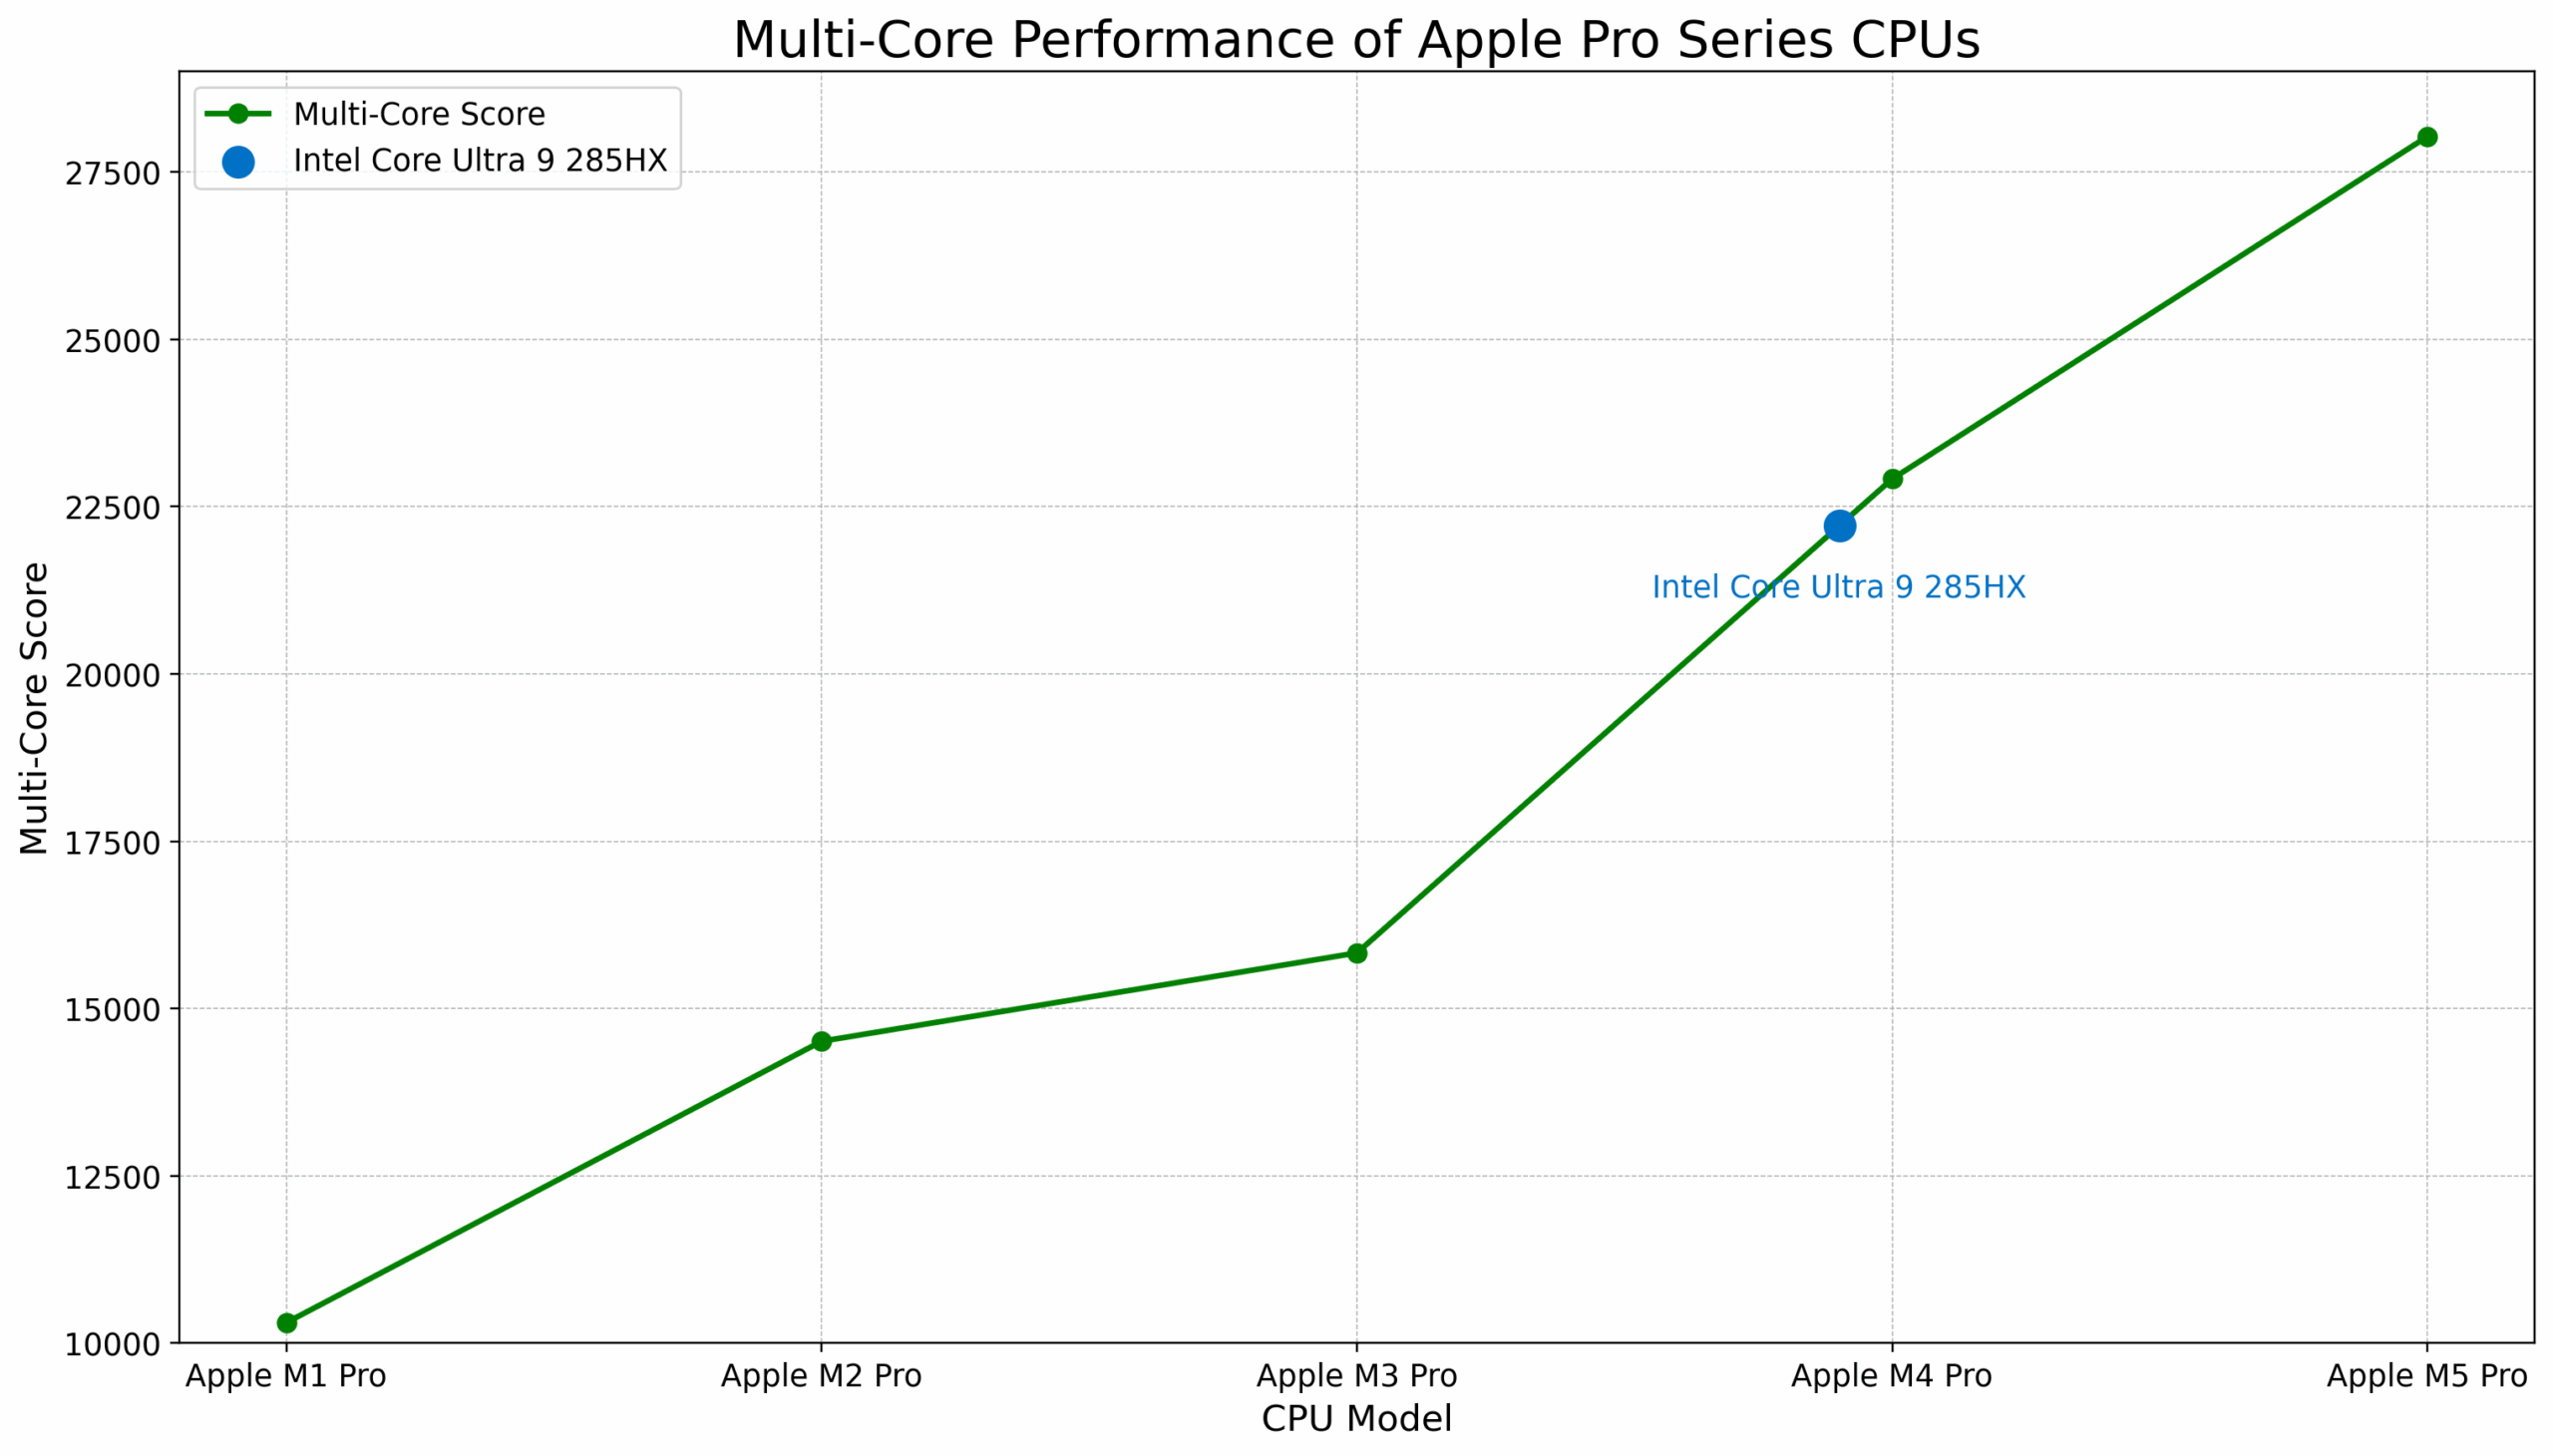
| CPU | Geekbench 6 Multi-Core | Leistungssprung (%) |
| Apple M1 Pro (8-Kern-CPU) | 10 307 | |
| Apple M2 Pro (12-Kern-CPU) | 14 511 | +41% |
| Apple M3 Pro (12-Kern-CPU) | 15 831 | +9% |
| Apple M4 Pro (14-Kern-CPU) | 22 914 | +45% |
| Apple M5 Pro (18-Kern-CPU) | 28030 | +22% |
| Durchschnittlicher Leistungssprung: 29% | ||
Apple M1 Max vs. M2 Max vs. M3 Max vs. M4 Max vs. M5 Max
Der M3 Max war der einzige Apple Prozessor, der Intels damaliges Flaggschiff i9-14900HX beim Vergleich mobiler Prozessoren übertraf. Jetzt ist das blaue Flaggschiff der Intel Core Ultra 9 285HX, und sein Multi-Core-Ergebnis liegt genau zwischen M3 Max und M4 Max.
Der M5 Max erreicht 29 159 Punkte und liegt damit 31 % über dem 285HX:
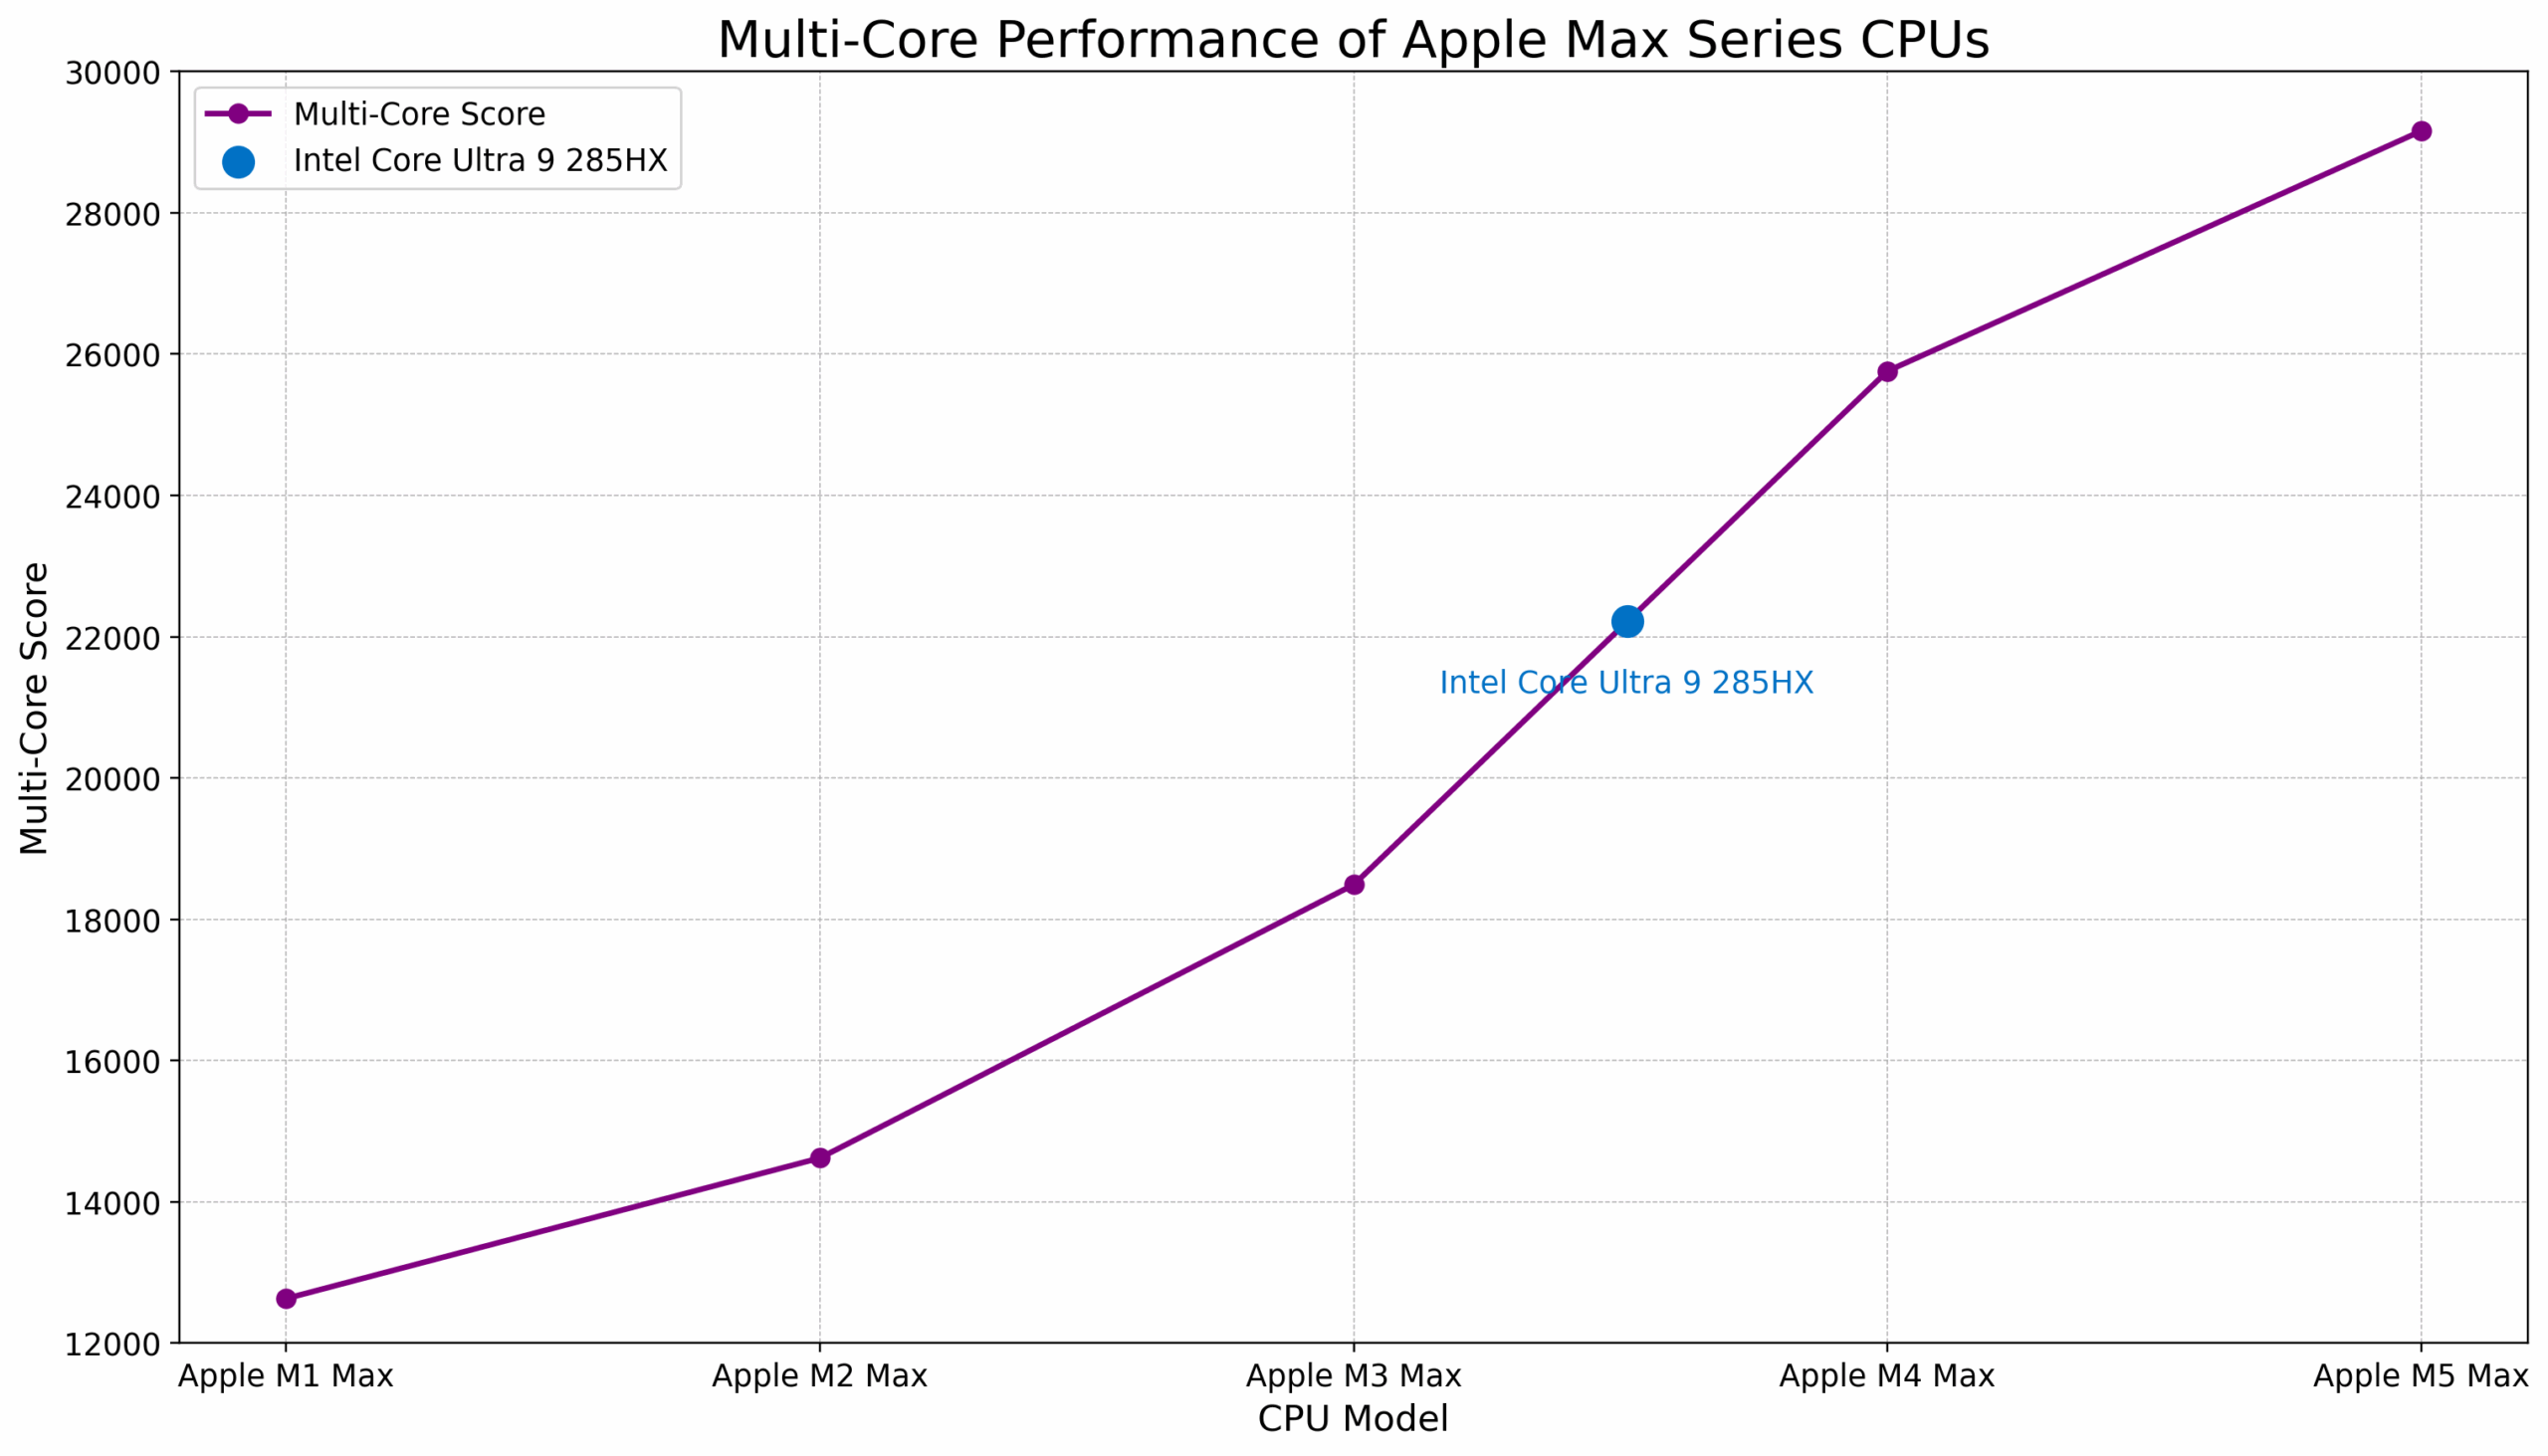
| CPU | Geekbench 6 Multi-Core | Leistungssprung (%) |
| Apple M1 Max (10-Kern-CPU) | 12 631 | |
| Apple M2 Max (12-Kern-CPU) | 14 621 | +16% |
| Apple M3 Max (14-Kern-CPU) | 18 490 | +26% |
| Apple M4 Max (16-Kern-CPU) | 25 760 | +39% |
| Apple M5 Max (18-Kern-CPU) | 29 159 | +13% |
| Durchschnittlicher Leistungssprung: 24% | ||
Apple M1 Ultra vs M2 Ultra vs M3 Ultra vs M4 Ultra und M5 Ultra (Hochrechnung)
Edit [03/2025]: Apple M3 Ultra wurde viel später als erwartet veröffentlicht, aber es ist da, und es ist ein riesiges Update – 33% Leistungssprung! Dies verändert die Prognose für das M4 Ultra von 33 773 Punkten auf 37 867 Punkte, und die Prognose für das M5 Ultra klettert auf wahnsinnige 42 864 Punkte!
Da Ultra-Chips in der Regel in Desktop-Konfigurationen verwendet werden, tauschen wir den mobilen Intel Core Ultra 9 285HX gegen das Desktop-Flaggschiff Intel Core Ultra 9 285K aus, das im Multi-Core-Test 22.000 Punkte erzielt und 4 % schneller ist als der M2 Ultra.
Infolgedessen wird erwartet, dass der M4 Ultra 72% schneller ist als der Intel Core Ultra 9 285K und der M5 Ultra könnte doppelt so schnell sein wie der Intel Core Ultra 9 285K. Natürlich ist das nur eine Hochrechnung, und Apple müsste den Mac Studio wahrscheinlich neu gestalten, um einen M4 Ultra oder M5 Ultra darin unterzubringen.
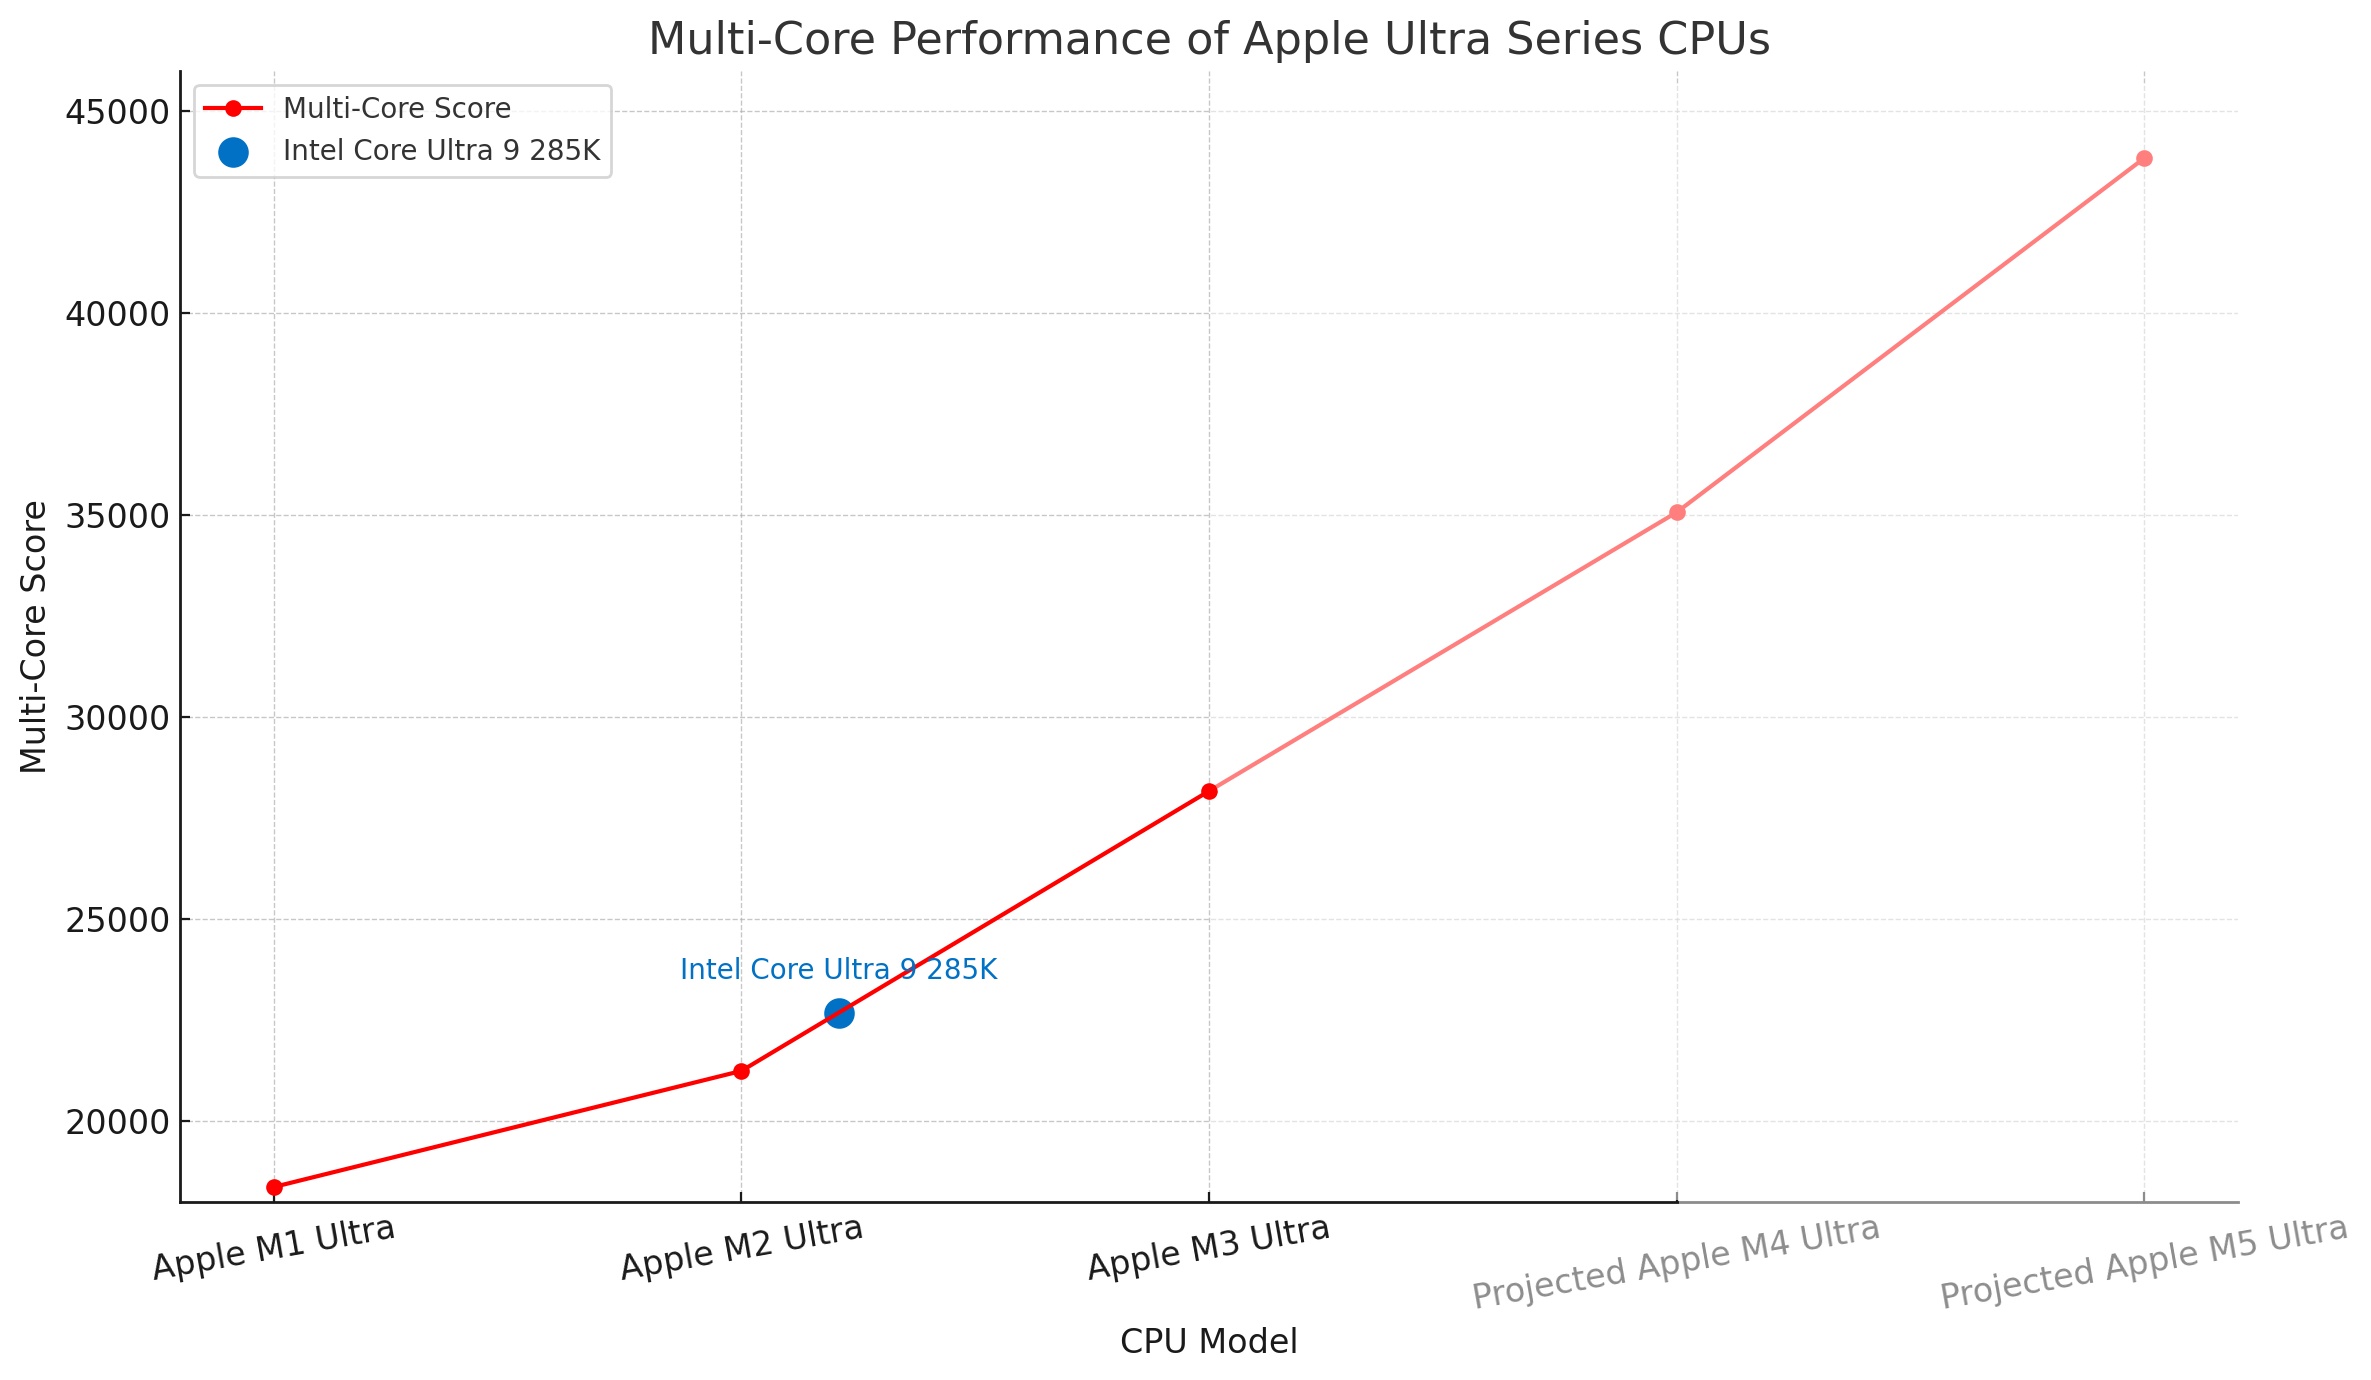
| CPU | Geekbench 6 Multi-Core | Leistungssprung (%) |
| Apple M1 Ultra | 18 367 | |
| Apple M2 Ultra | 21 241 | +16% |
| Apfel M3 Ultra | 28 169 | +33% |
| Hochgerechnet Apple M4 Ultra | 37 867 | +34% |
| Hochgerechnetes Apple M5 Ultra | 42 864 | +13% |
| Durchschnittlicher Leistungssprung: 25% | ||
Der ultimative Vergleich:
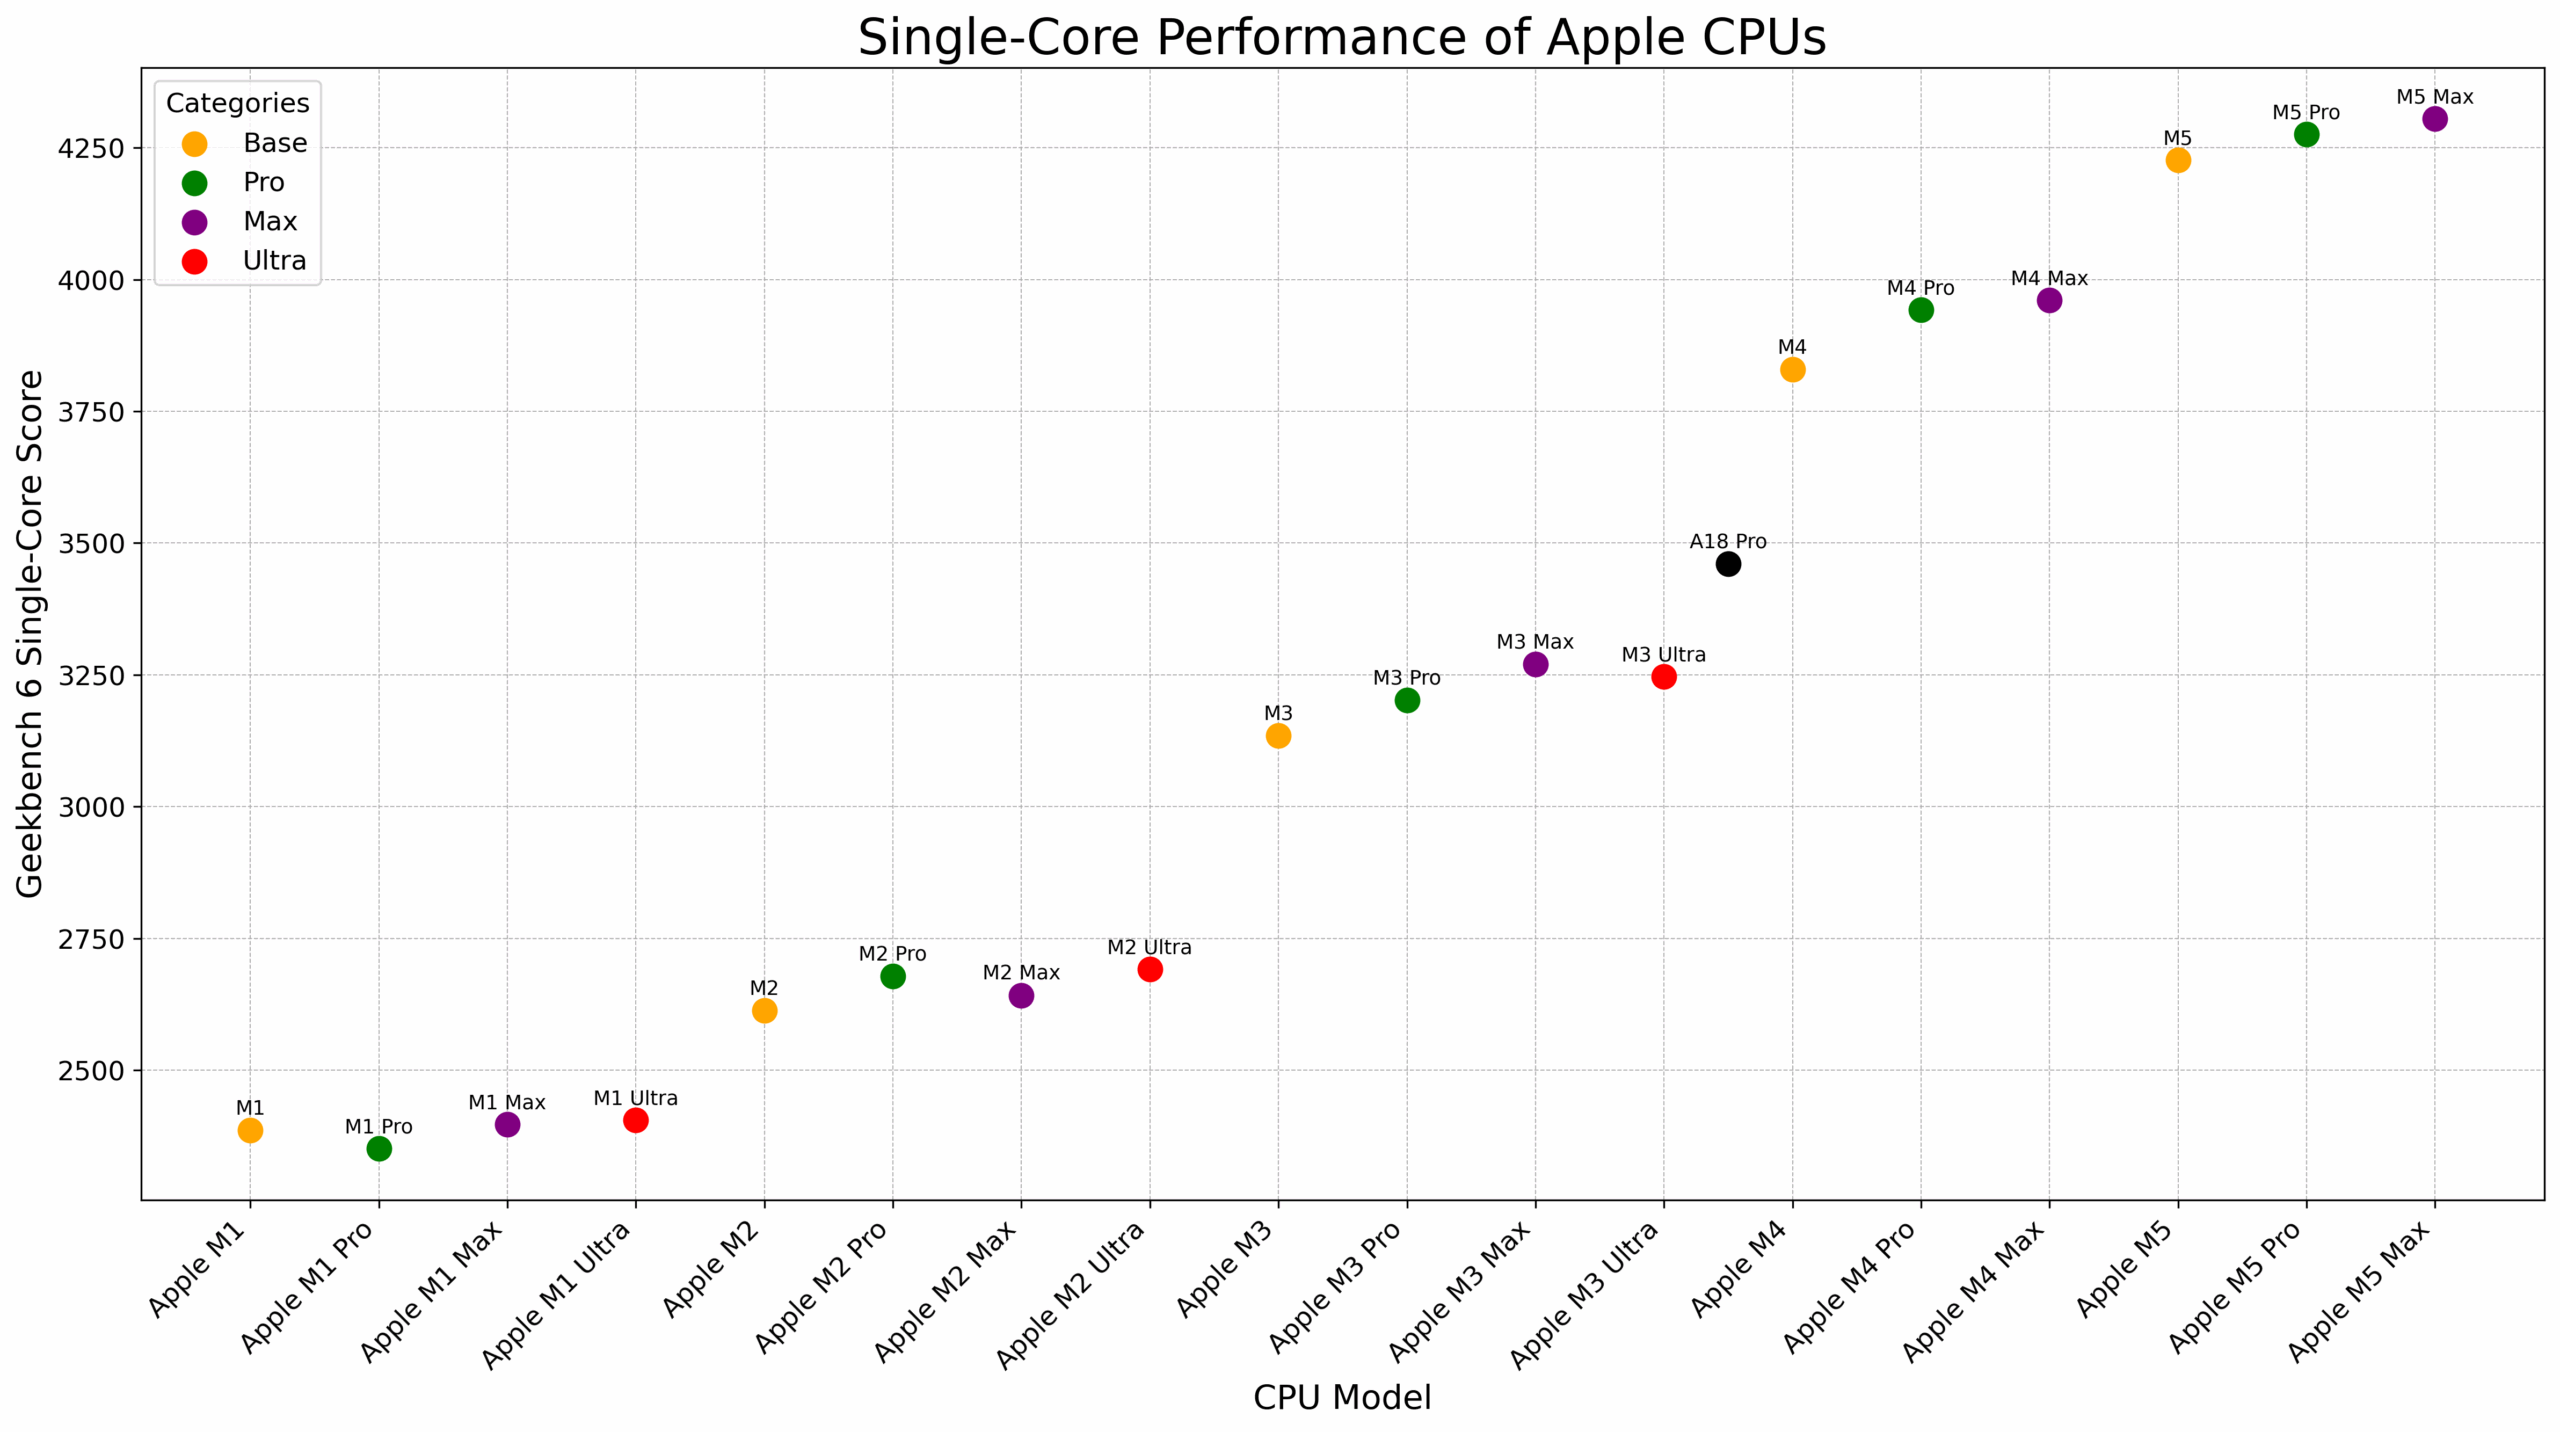
Lassen Sie uns nun einen gründlichen Vergleich aller Apple M-Serien-CPUs anhand konkreter Daten durchführen.
Der neueste Apple M5-Prozessor ist die schnellste CPU in Bezug auf die Single-Core-Leistung:
Wenn es um schwere Arbeit geht, hat der Apple M5 eine Multi-Core-Leistung, die mit der kleineren Variante des M3 Max (14-Core) vergleichbar ist und 14 % unter dem M4 Pro (12-Core) liegt. Die M4 Max-Variante rühmt sich jedoch mit einer außergewöhnlichen Speicherbandbreite (409,6 GB/s), die 3-4x so hoch ist wie die des M4 (120 GB/s) und 2x so hoch wie die des M2 Pro (204,8 GB/s), was sich für KI-Projekte als vorteilhaft erweist. Der König für KI ist der Apple M3 Ultra mit 28.000+ Multi-Core-Scores und 819,3 GB/s Speicherbandbreite.
Die Variante M5 Pro erreicht die Multicore-Leistung des M3 Ultra, und der M5 Max ist sogar noch leistungsfähiger:
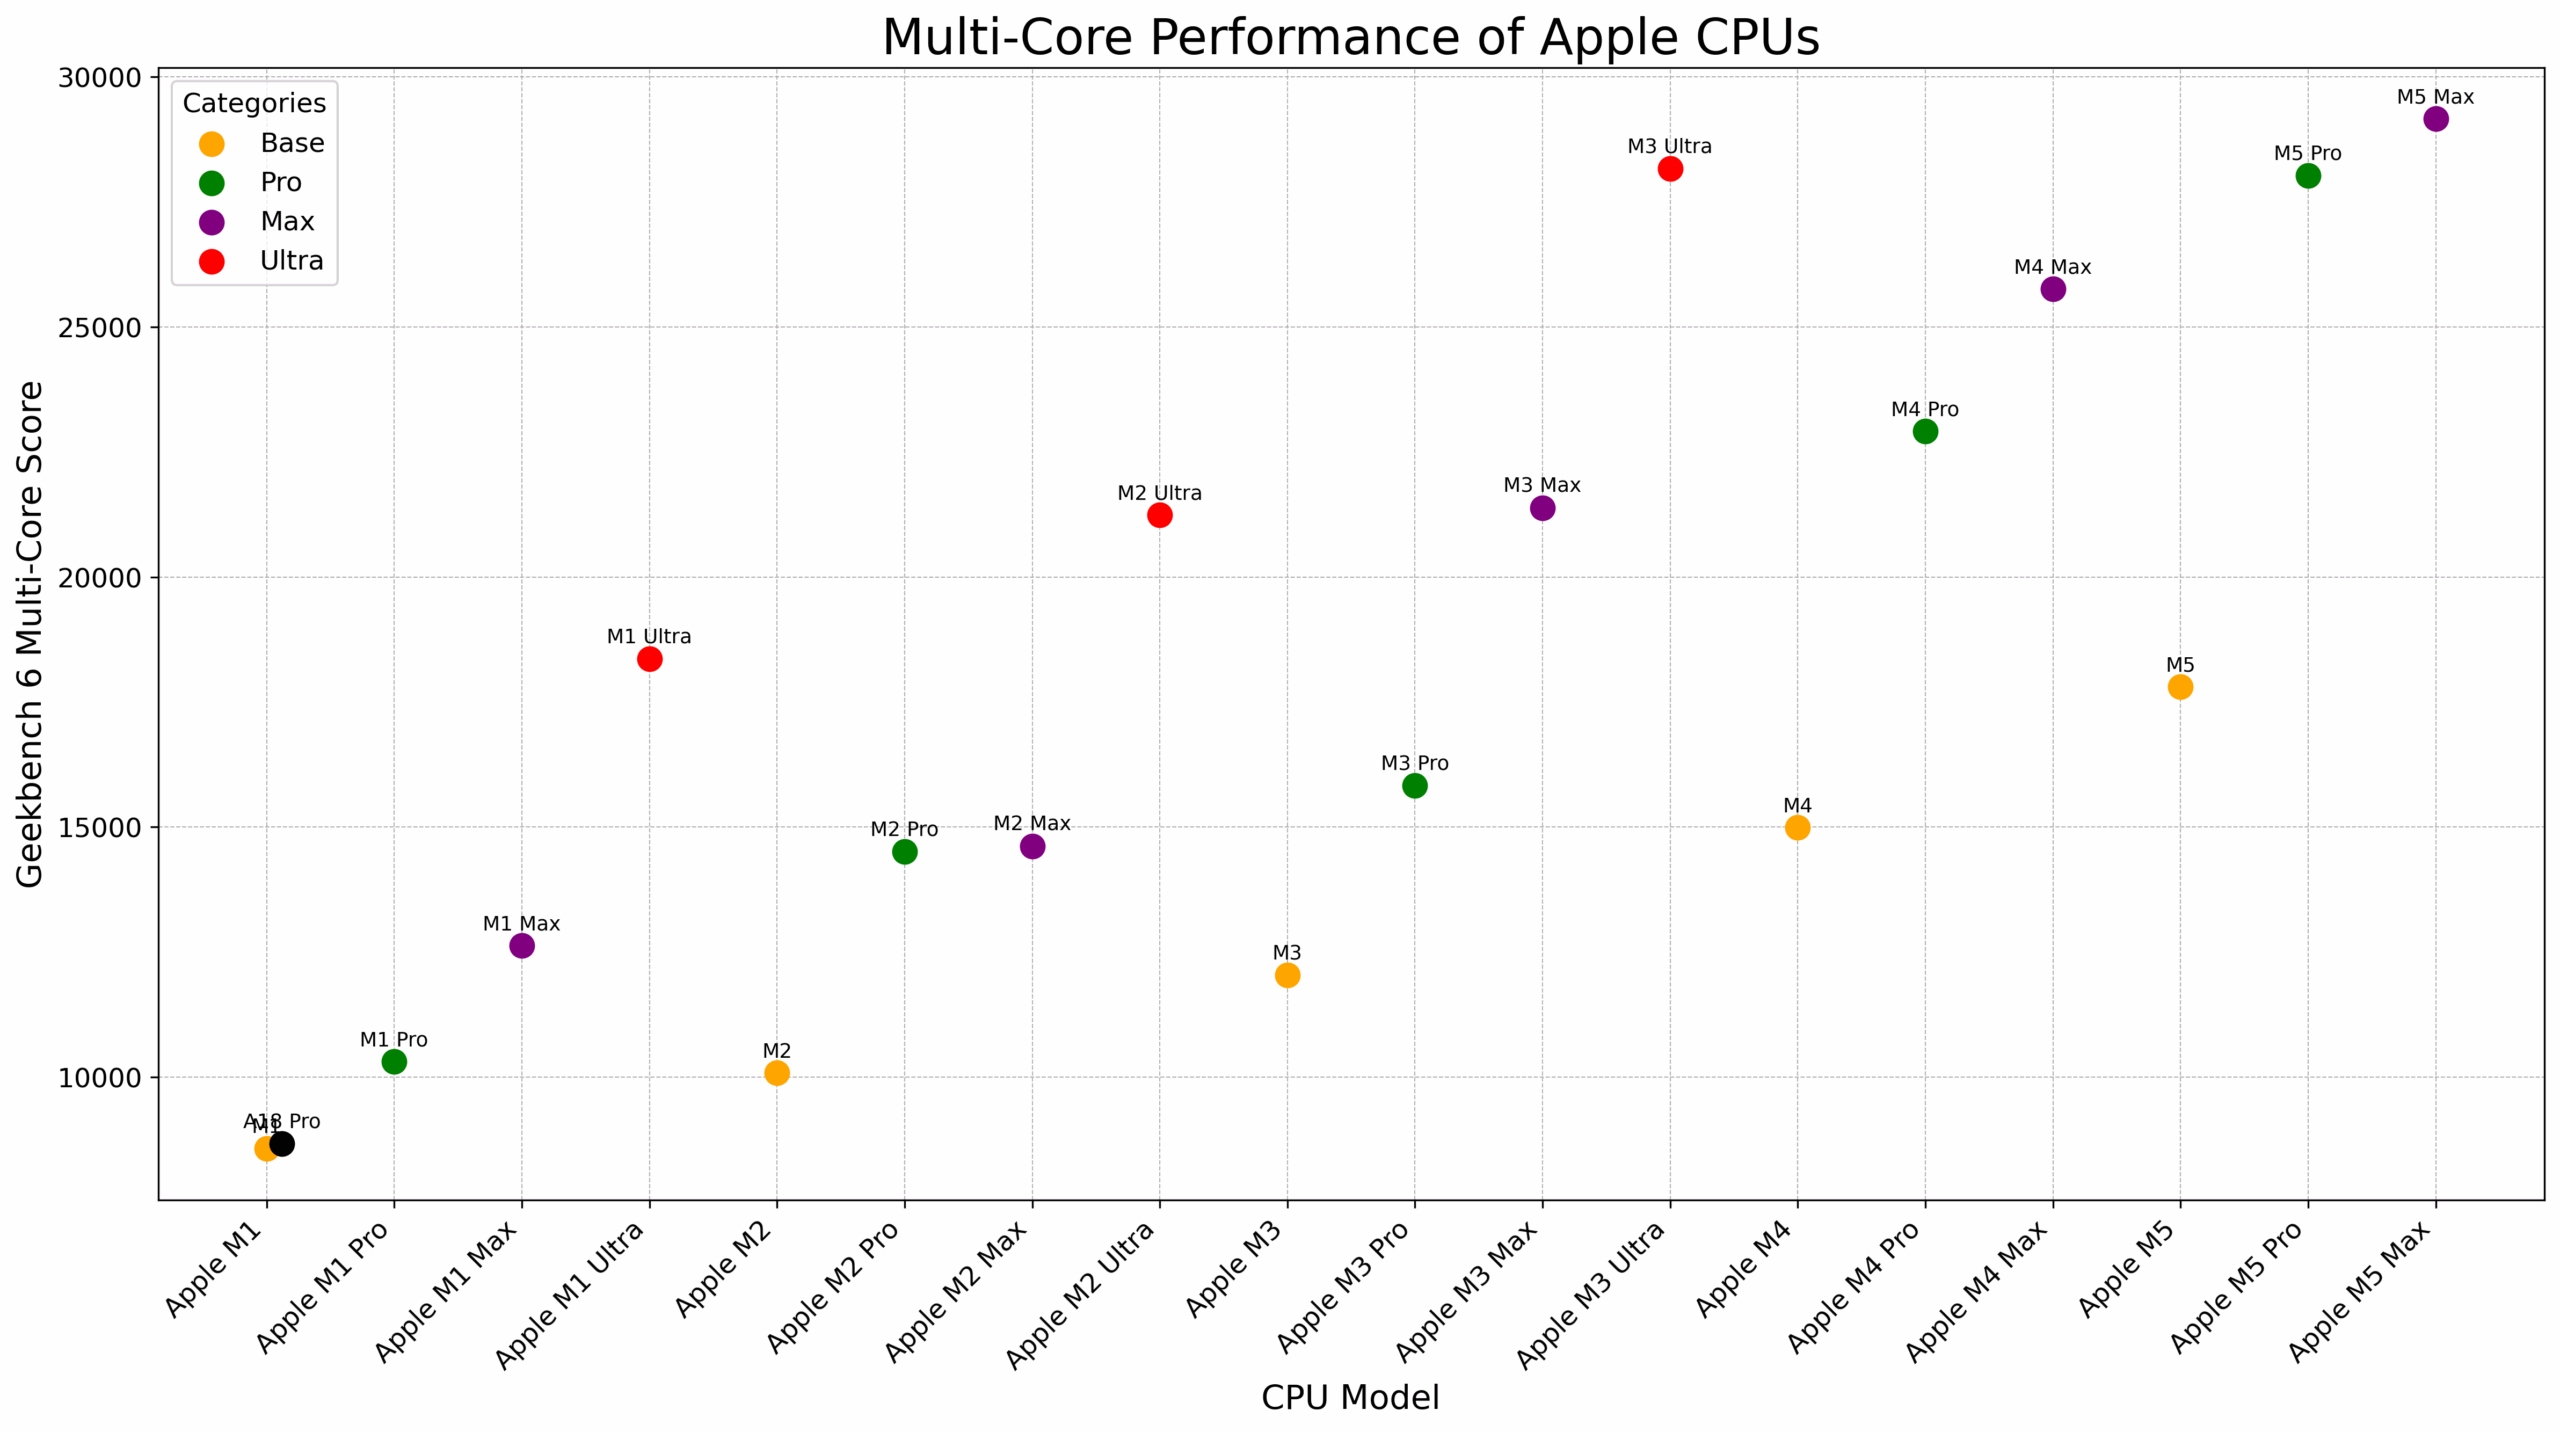
Wir haben oben nur die leistungsstärksten CPU-Varianten hervorgehoben, wenn mehrere Versionen desselben Modells existieren. Hier finden Sie die vollständige Liste aller Prozessoren der M-Serie und ihre Single- und Multi-Core-Werte:
| CPU | Single-Core-Bewertung | Multi-Core-Bewertung |
|---|---|---|
| Apple M5 Max (18-Kern-CPU) | 4305 | 29159 |
| Apple M5 Pro (18-Kern-CPU) | 4276 | 28030 |
| Apple M5 Pro (15-Kern-CPU) | TBD | TBD |
| Apple M5 (10-Kern-Prozessor) | 4227 | 17802 |
| Apple M5 (9-Kern) | 4103 | 15308 |
| Apple M4 Max (16 Kerne) | 3880 | 25760 |
| Apple M4 Max (14 Kerne) | 3961 | 22725 |
| Apple M4 Pro (14 Kerne) | 3943 | 22914 |
| Apple M4 Pro (12 Kerne) | 3922 | 20622 |
| Apple M4 (10 Kerne) | 3830 | 14990 |
| Apple M4 (9-Kern) | 3671 | 13381 |
| Apple M4 (8-Kern) | 3650 | 13836 |
| Apple M3 Ultra (32-Kern-CPU) | 3247 | 28169 |
| Apple M3 Ultra (28-Kern-CPU) | 3244 | 27091 |
| Apple M3 Max (16-Kern-CPU) | 3270 | 21385 |
| Apple M3 Max (14-Kern-CPU) | 3109 | 18490 |
| Apple M3 Pro (12-Kern-CPU) | 3202 | 15831 |
| Apple M3 Pro (11-Kern-CPU) | 3067 | 14453 |
| Apple M3 (8-Kern-CPU) | 3135 | 12042 |
| Apple M2 Ultra (24-Kern-CPU) | 2691 | 21241 |
| Apple M2 Max (12-Kern-CPU) | 2642 | 14621 |
| Apple M2 Pro (12-Kern-CPU) | 2678 | 14511 |
| Apple M2 Pro (10-Kern-CPU) | 2590 | 11455 |
| Apple M2 (8-Kern-CPU) | 2613 | 10082 |
| Apple M1 Ultra (20-Kern-CPU) | 2405 | 18367 |
| Apple M1 Max (10-Kern-CPU) | 2397 | 12631 |
| Apple M1 Pro (8-Kern-CPU) | 2351 | 10307 |
| Apple M1 (8-Kern-CPU) | 2386 | 8571 |
Wir hoffen, dass diese Zusammenfassung Ihnen bei der Entscheidung für eine CPU der M-Serie hilft.
Vielleicht finden Sie auch unsere anderen Analysen interessant:
Die Lücke wird unheimlich: Apple lässt Intel im Staub zurück
Und natürlich sollten Sie unseren Vergleich mit dem neuen, aufregenden Qualcomm Snapdragon X Elite nicht verpassen:
Apple M4 vs Snapdragon X Elite – Der Kampf der nächsten CPU-Generation
 Author: Simeon NikolovEditor-in-Chief at LaptopMedia.com with 20+ years of experience in testing and analyzing laptops and mobile devices.

![[August 2026] Amazon Global: Die 10 meistverkauften Laptops – Das Apple MacBook Neo führt die Charts an, während preisgünstige und Mittelklasse-Windows-Laptops um Absatzzahlen kämpfen](https://laptopmedia.com/wp-content/uploads/2026/09/Best-Selling-Laptops-GLOBAL-Top-10-400x225.jpg)
![[August 2026] Die meistverkauften Laptop-Marken bei Amazon Global – Apple dominiert den Umsatz, während HP bei der Modellvielfalt führend ist](https://laptopmedia.com/wp-content/uploads/2026/09/GLOBAL-Best-Brands-400x225.jpg)
![[August 2026] Amazon Global: Die 10 meistverkauften Gaming-Laptops – Der HP Victus 15 erobert den ersten Platz, während preisgünstige Modelle die Rangliste dominieren](https://laptopmedia.com/wp-content/uploads/2026/09/Best-Selling-Gaming-Laptops-GLOBAL-Top-10-400x225.jpg)
![[August 2026] Best-Selling Laptop Brands on Amazon Japan – Apple Dominates Market Share and Revenue Led by Strong Unit Sales](https://laptopmedia.com/wp-content/uploads/2026/09/CO.JP-Best-Brands-1-400x225.jpg)
![[August 2026] Best-Selling Laptop Brands on Amazon USA – Apple Dominates Market Revenue and Volume Despite Lower Model Diversity](https://laptopmedia.com/wp-content/uploads/2026/09/COM-Best-Brands-1-400x225.jpg)

这个文章总结的太棒了,什么神仙编辑,把我想要的信息都罗列出来了
这条评论真是太温暖了,让我非常开心!谢谢你,Yesir!
—
That was the most heartwarming comment; it made my day! Thank you, Yesir!
Best Apple M chips analysis
Thank you very much, wu wei!
赞 赞 赞 加鸡腿
🙂 👍
incredible comparison design. any chance for gpu/npu?
Good idea!
Great article, would love to see update with GPU performance gain comparsion too
Perfect analysis. There are all I want to get!
Hello, I don’t get the comparison with i9-14900K .. it’s just purposely written and depicted to make apple chips better … In reality i9 cpu that was used as a reference point is on the top of the list
Check this out, bro, https://versus.com/en/intel-core-i9-14900hx-vs-intel-core-i9-14900k
I had a look at your chart which does not include the M5 and the graphs above are accurate.
The i9-14900K only beats the lower spec Apple chips at multi core performance and Cinebench. It trails everywhere else.
You seem to be going off the Crossmark Overall score which is distorted by the large number of No Value results for the Apple chips because some of the tests do not run on the Macs.
I had a look at your chart which does not include the M5 and the graphs above are accurate.
The i9-14900K only beats the lower spec Apple chips at multi core performance and Cinebench. It trails everywhere else.
You seem to be going off the Crossmark Overall score which is distorted by the large number of No Value results for the Apple chips because some of the tests do not run on the Macs.
Great effort for putting together such an extensive comparison. I only wish the Y-axis started at zero because at the moment, you’ve artificially amplified the true relative difference between all of them.
Thank you, WFR! While a zero-start axis is indeed the safest choice for showing absolute performance, my goal here was slightly different. I wanted to highlight the relative uplift between generations, using the M1 (2020) as a baseline, so readers can quickly judge “how big is the jump from what I have to what I’m considering” (with the added context of Intel CPUs as well). I initially tried charts starting at zero, but the bars became compressed and the differences between closer generations were much harder to read at a glance. For example, if you’re on M4 and mostly care… Read more »
You do not show the relative uplift if you chop off the lower part of the graph.
For relative values you HAVE to show the whole enchalada, not the clipped M4 minus M1 which make the M1 zero value.
The % uplift you show in the figures actually works off the WHOLE value not a clipped value.
It would be great to have all M series Apple silicon GPU benchmarks.
每次都看这个总结,各种对比数据太清晰了,期待m5pro和max的加入,感谢你的付出
Thank you! The new models are coming to our lab, stay tuned for full analysis and reviews!
—-
谢谢!新模型即将送达我们的实验室,敬请期待完整的分析和评测!
Amazing! I was just about to do a spreadsheet on exactly this and found this site immediately. Thanks for the great work. 😃👏 All that’s missing is a “Bangs for Bucks chart” with the performance rated against price for each model. Just one suggestion. The Charts are too big for the information. If they were smaller you could take in all the information withouy scrolling. You should always start charts them from zero clipping them does not show the correct relativity. For the pricing I’d tilt the charts to axonometric view with $ as the height off the chart. We… Read more »
It would be even better if there were a graphics performance rating.
This is the most detailed and best article I have ever seen! This has provided me with great help in choosing m chips. Thank you so much!