Dell Latitude 14 9430 review – classic performance from a classy product
Performance: CPU, GPU, Gaming Tests
CPU options
This laptop can be found with the Core i5-1245U or the Core i7-1265U.
Results are from the Cinebench R23 CPU test (the higher the score, the better)


Results are from our Photoshop benchmark test (the lower the score, the better)
Dell Latitude 14 9430 CPU variants
Here you can see an approximate comparison between the CPUs that can be found in the Dell Latitude 14 9430 models on the market. This way you can decide for yourself which Dell Latitude 14 9430 model is the best bang for your buck.
Note: The chart shows the cheapest different CPU configurations so you should check what the other specifications of these laptops are by clicking on the laptop’s name / CPU.
Results are from the Cinebench R23 CPU test (the higher the score, the better)
Results are from our Photoshop benchmark test (the lower the score, the better)
GPU options
You get no choice regarding the GPU, as there are no dedicated options.
Results are from the 3DMark: Time Spy (Graphics) benchmark (higher the score, the better)
Results are from the 3DMark: Fire Strike (Graphics) benchmark (higher the score, the better)
Results are from the 3DMark: Wild Life benchmark (higher the score, the better)
Results are from the Unigine Superposition benchmark (higher the score, the better)
Dell Latitude 14 9430 GPU variants
Here you can see an approximate comparison between the GPUs that can be found in the Dell Latitude 14 9430 models on the market. This way you can decide for yourself which Dell Latitude 14 9430 model is the best bang for your buck.
Note: The chart shows the cheapest different GPU configurations so you should check what the other specifications of these laptops are by clicking on the laptop’s name / GPU.
Results are from the 3DMark: Time Spy (Graphics) benchmark (higher the score, the better)
Results are from the 3DMark: Fire Strike (Graphics) benchmark (higher the score, the better)
Results are from the 3DMark: Wild Life (Graphics) benchmark (higher the score, the better)
Results are from the Unigine Superposition benchmark (higher the score, the better)
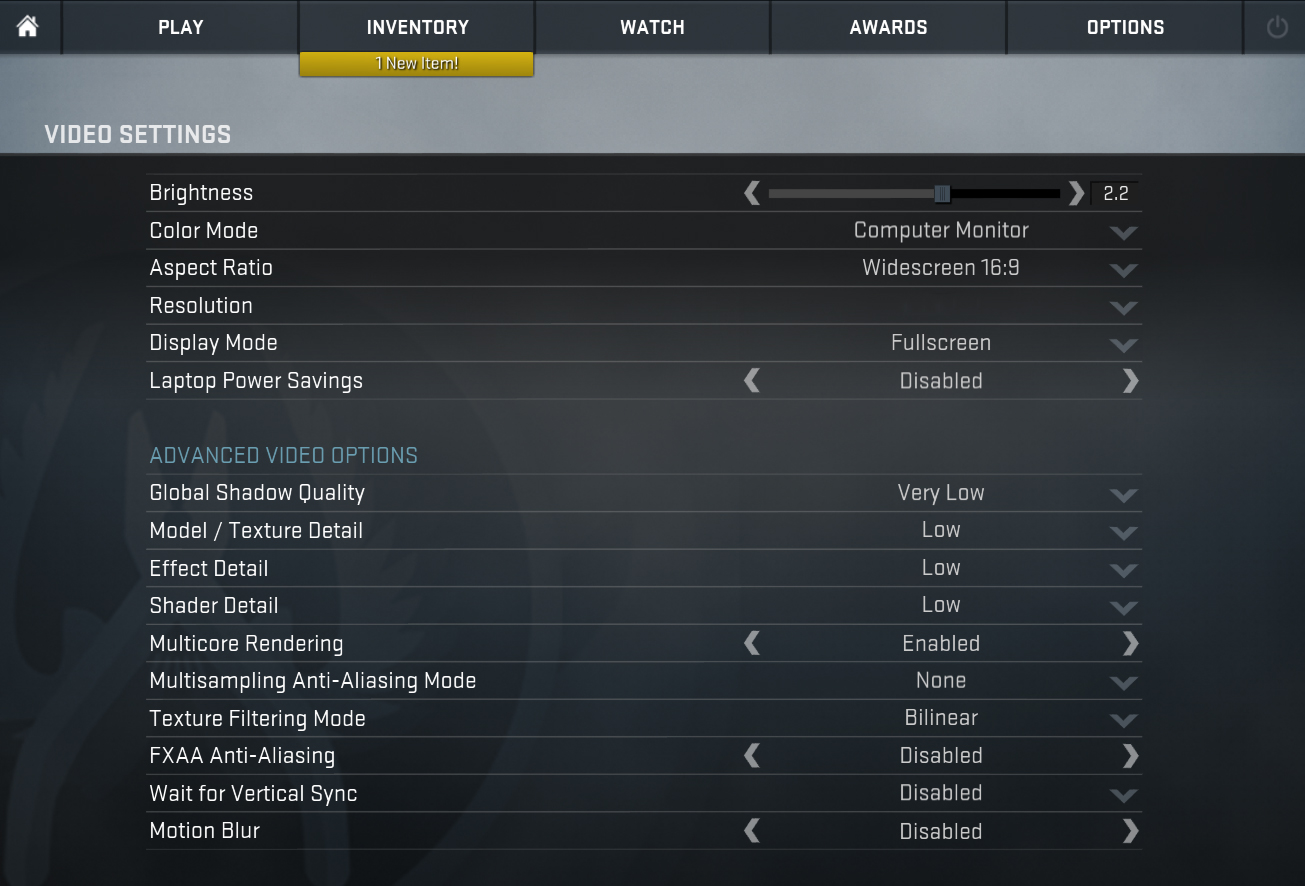
Gaming tests

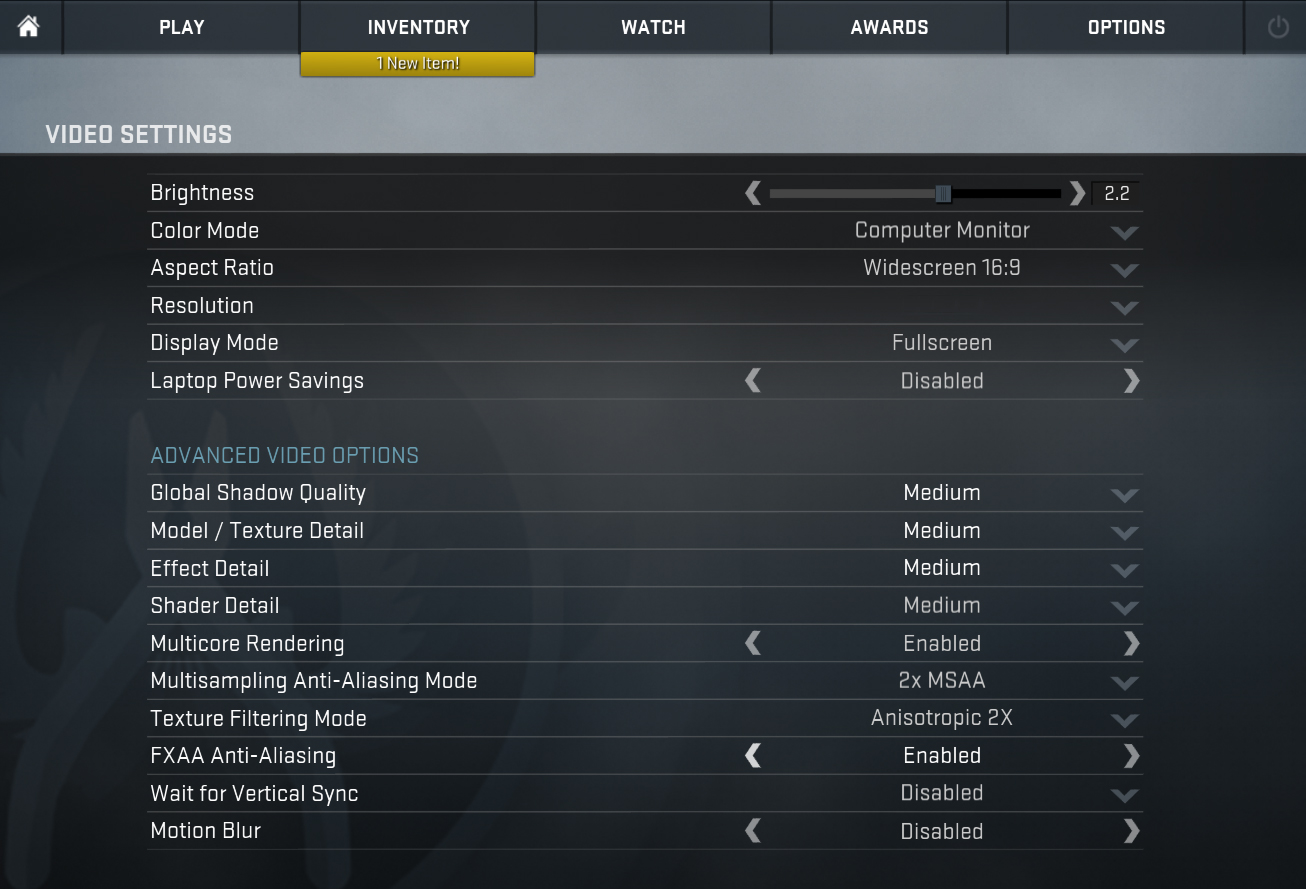
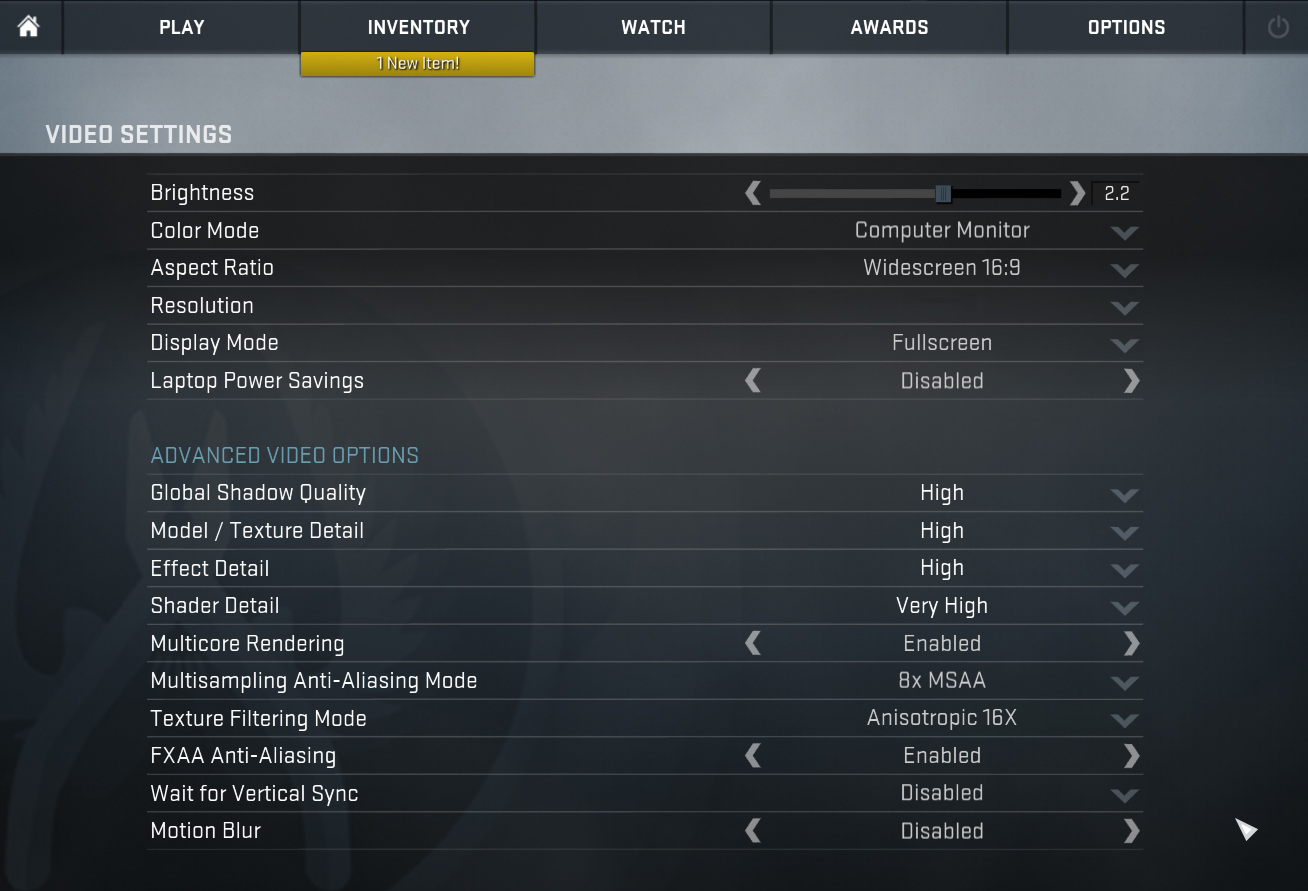
| CS:GO | HD 1080p, Low (Check settings) | HD 1080p, Medium (Check settings) | HD 1080p, MAX (Check settings) |
|---|---|---|---|
| Average FPS | 167 fps | 130 fps | 83 fps |

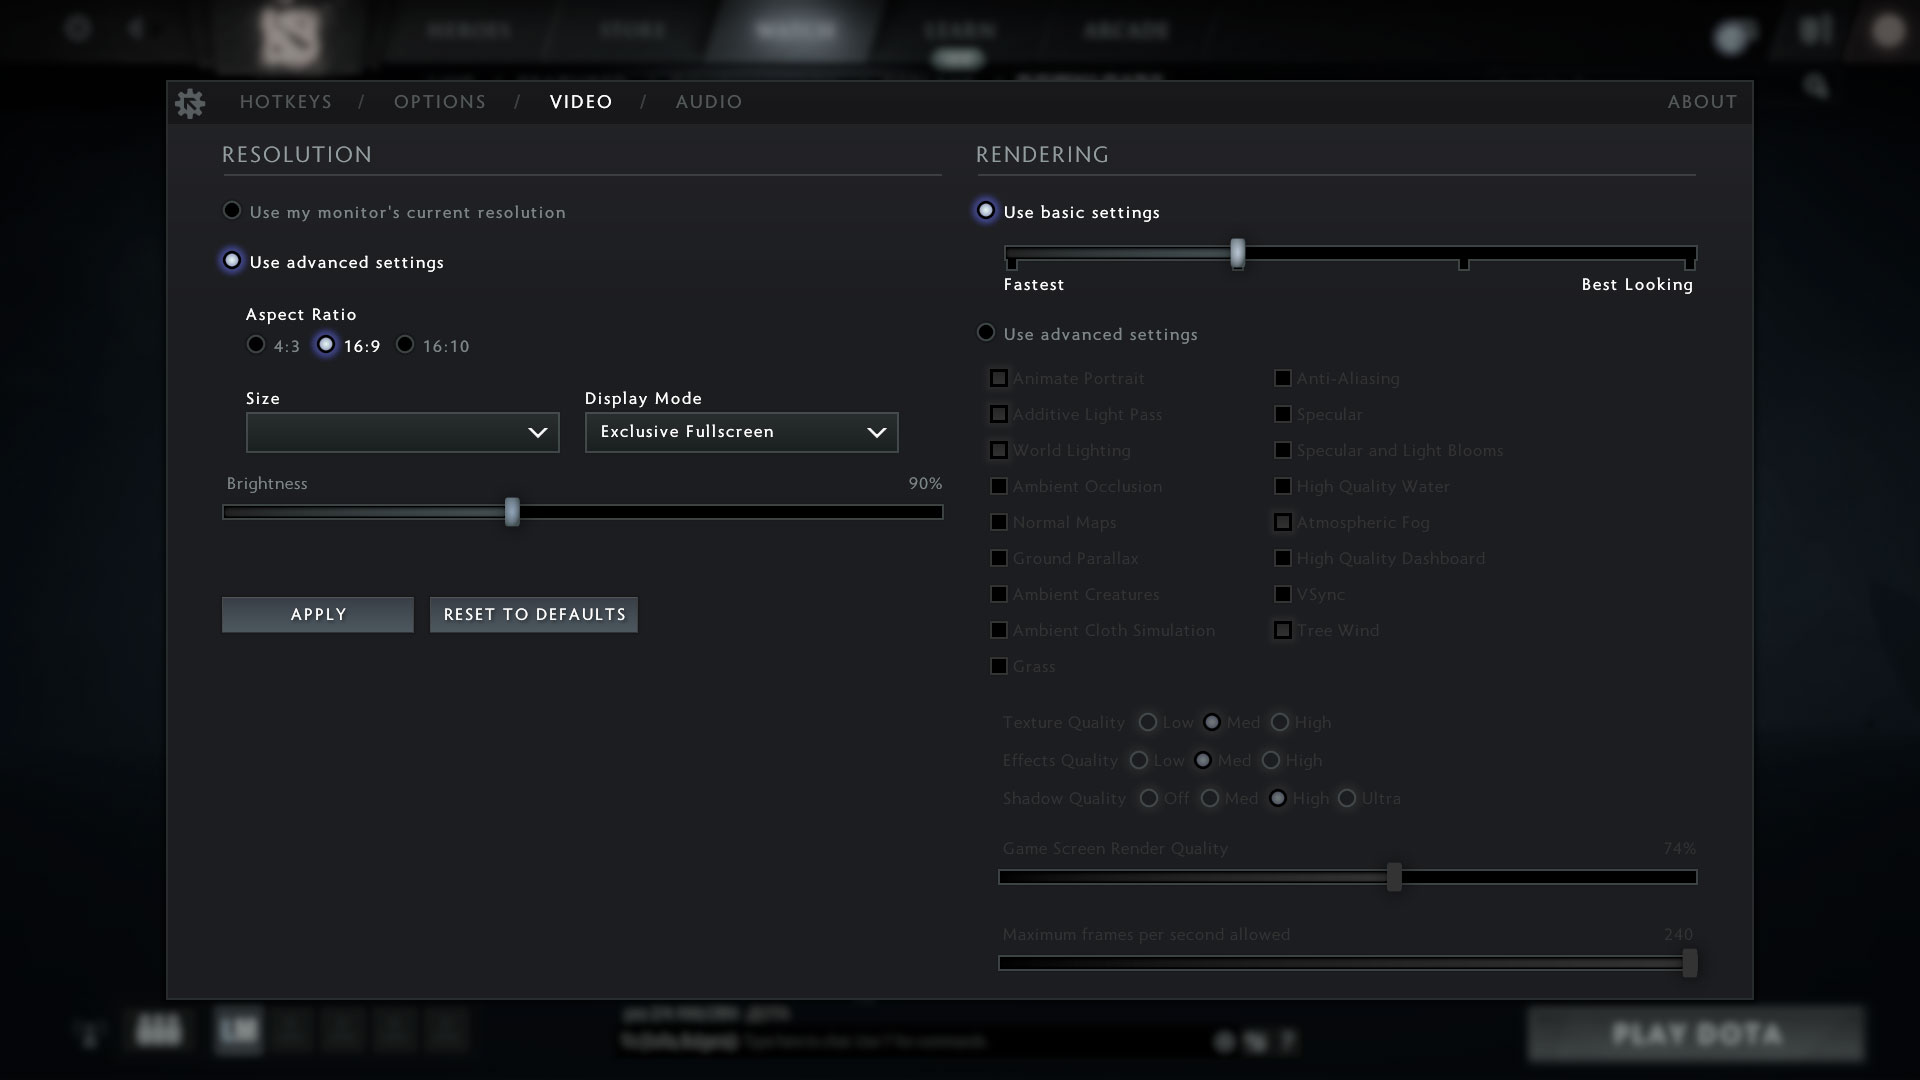
| DOTA 2 | HD 1080p, Low (Check settings) | HD 1080p, Normal (Check settings) | HD 1080p, High (Check settings) |
|---|---|---|---|
| Average FPS | 141 fps | 102 fps | 67 fps |


