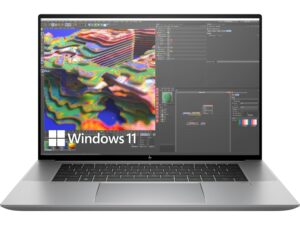
HP ZBook Firefly 16 G10 review – the CPU clock under heavy load is low but the battery life is impressive
Performance: CPU, GPU, Gaming Tests
CPU options
This laptop can be configured with the Intel Core i5-1335U, Core i5-1345U, Core i7-1355U, Core i7-1365U, Core i5-1340P, Core i5-1350P, Core i7-1360P, or Core i7-1370P.
Results are from the Cinebench R23 CPU test (the higher the score, the better)


Results are from our Photoshop benchmark test (the lower the score, the better)
HP ZBook Firefly 16 G10 CPU variants
Here you can see an approximate comparison between the CPUs that can be found in the HP ZBook Firefly 16 G10 models on the market. This way you can decide for yourself which HP ZBook Firefly 16 G10 model is the best bang for your buck.
Note: The chart shows the cheapest different CPU configurations so you should check what the other specifications of these laptops are by clicking on the laptop’s name / CPU.
Results are from the Cinebench R23 CPU test (the higher the score, the better)
Results are from our Photoshop benchmark test (the lower the score, the better)
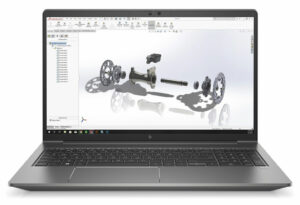
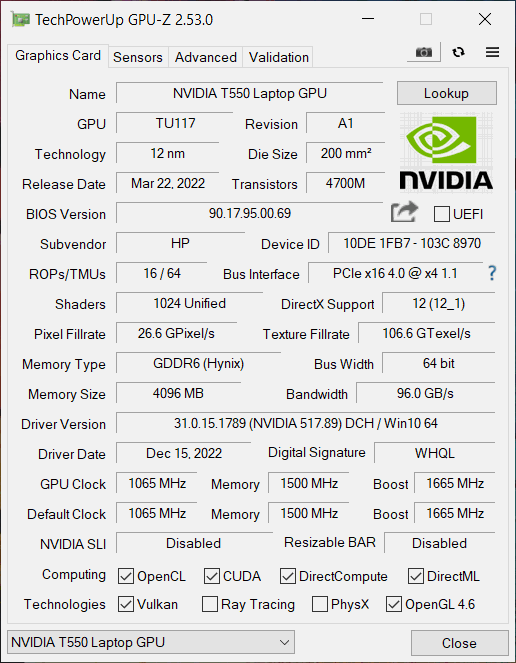
GPU options
You can get an iGPU-only configuration, or if you need more graphics power, there is an optional NVIDIA RTX A500 (Laptop, 30W).
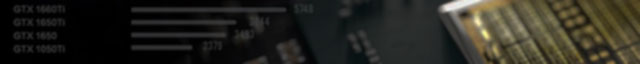
Results are from the 3DMark: Time Spy (Graphics) benchmark (higher the score, the better)
Results are from the 3DMark: Fire Strike (Graphics) benchmark (higher the score, the better)
Results are from the 3DMark: Wild Life benchmark (higher the score, the better)
Results are from the Unigine Superposition benchmark (higher the score, the better)
HP ZBook Firefly 16 G10 GPU variants
Here you can see an approximate comparison between the GPUs that can be found in the HP ZBook Firefly 16 G10 models on the market. This way you can decide for yourself which HP ZBook Firefly 16 G10 model is the best bang for your buck.
Note: The chart shows the cheapest different GPU configurations so you should check what the other specifications of these laptops are by clicking on the laptop’s name / GPU.
Results are from the 3DMark: Time Spy (Graphics) benchmark (higher the score, the better)
Results are from the 3DMark: Fire Strike (Graphics) benchmark (higher the score, the better)
Results are from the 3DMark: Wild Life (Graphics) benchmark (higher the score, the better)
Results are from the Unigine Superposition benchmark (higher the score, the better)
Gaming tests

| Assassin’s Creed Valhalla | Full HD, Low (Check settings) | Full HD, Medium (Check settings) | Full HD, High (Check settings) | Full HD, Ultra (Check settings) |
|---|---|---|---|---|
| Average FPS | 56 fps | 43 fps | 32 fps | 26 fps |

| Borderlands 3 | Full HD, V.Low (Check settings) | Full HD, Medium (Check settings) | Full HD, High (Check settings) | Full HD, Badass (Check settings) |
|---|---|---|---|---|
| Average FPS | 75 fps | 49 fps | 31 fps | 24 fps |

| Far Cry 6 | Full HD, Low (Check settings) | Full HD, High (Check settings) | Full HD, Ultra (Check settings) |
|---|---|---|---|
| Average FPS | 56 fps | 42 fps | 35 fps |

| Gears 5 | Full HD, Low (Check settings) | Full HD, Medium (Check settings) | Full HD, High (Check settings) | Full HD, Ultra (Check settings) |
|---|---|---|---|---|
| Average FPS | 76 fps | 51 fps | 42 fps | 33 fps |
As you can see, the RTX A500 (Laptop, 30W) isn’t a powerhouse and it’s fast enough for Low to Medium details.