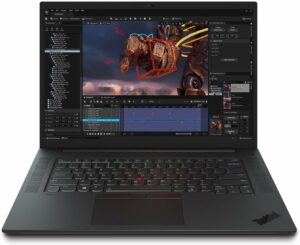
Lenovo ThinkPad P1 Gen 6 review – capable hardware, good comfort under load, and a lot of security features
Performance: CPU, GPU, Gaming Tests
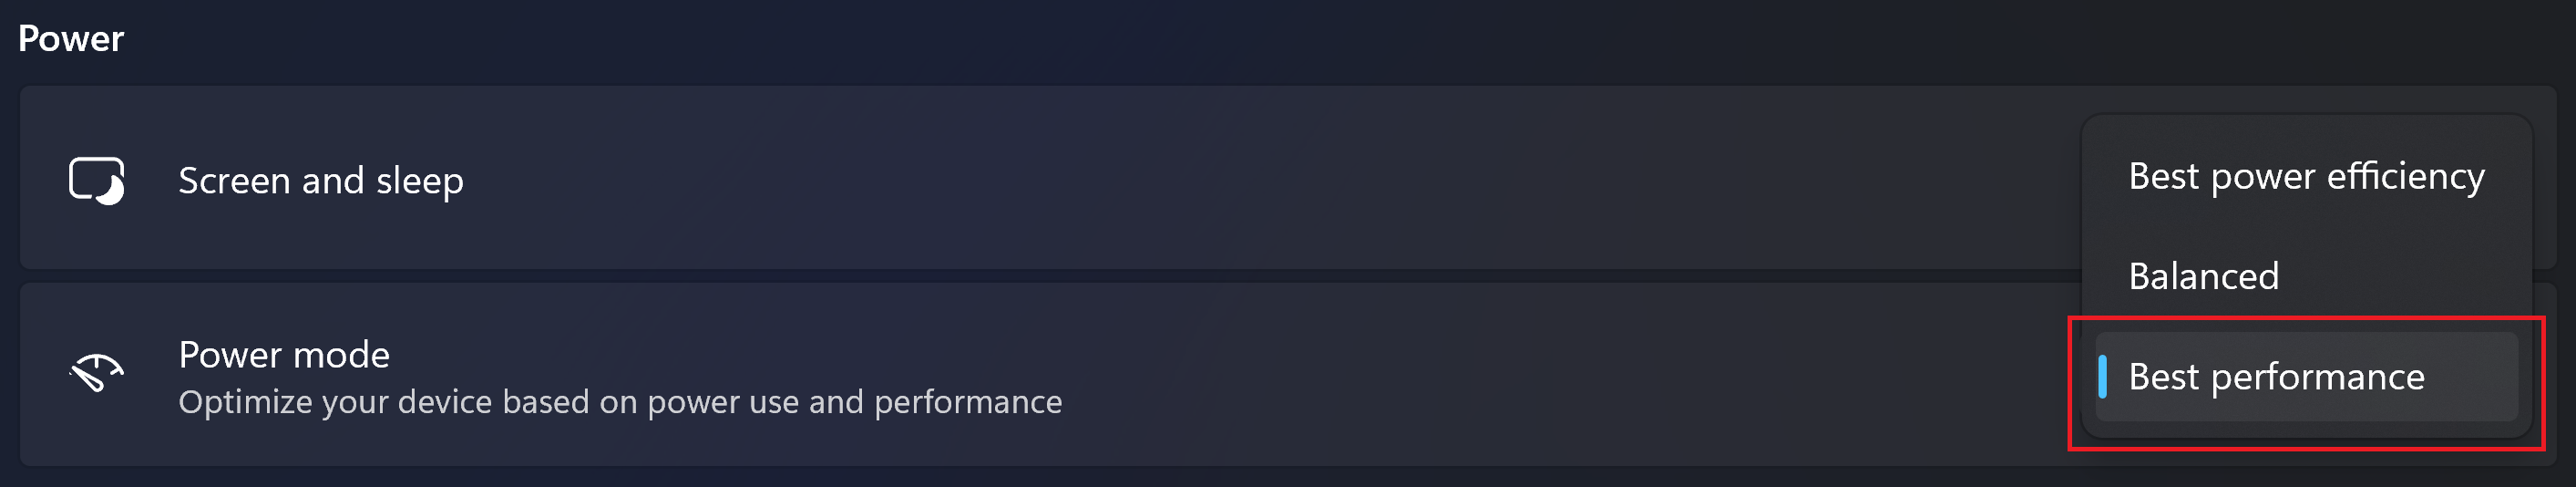
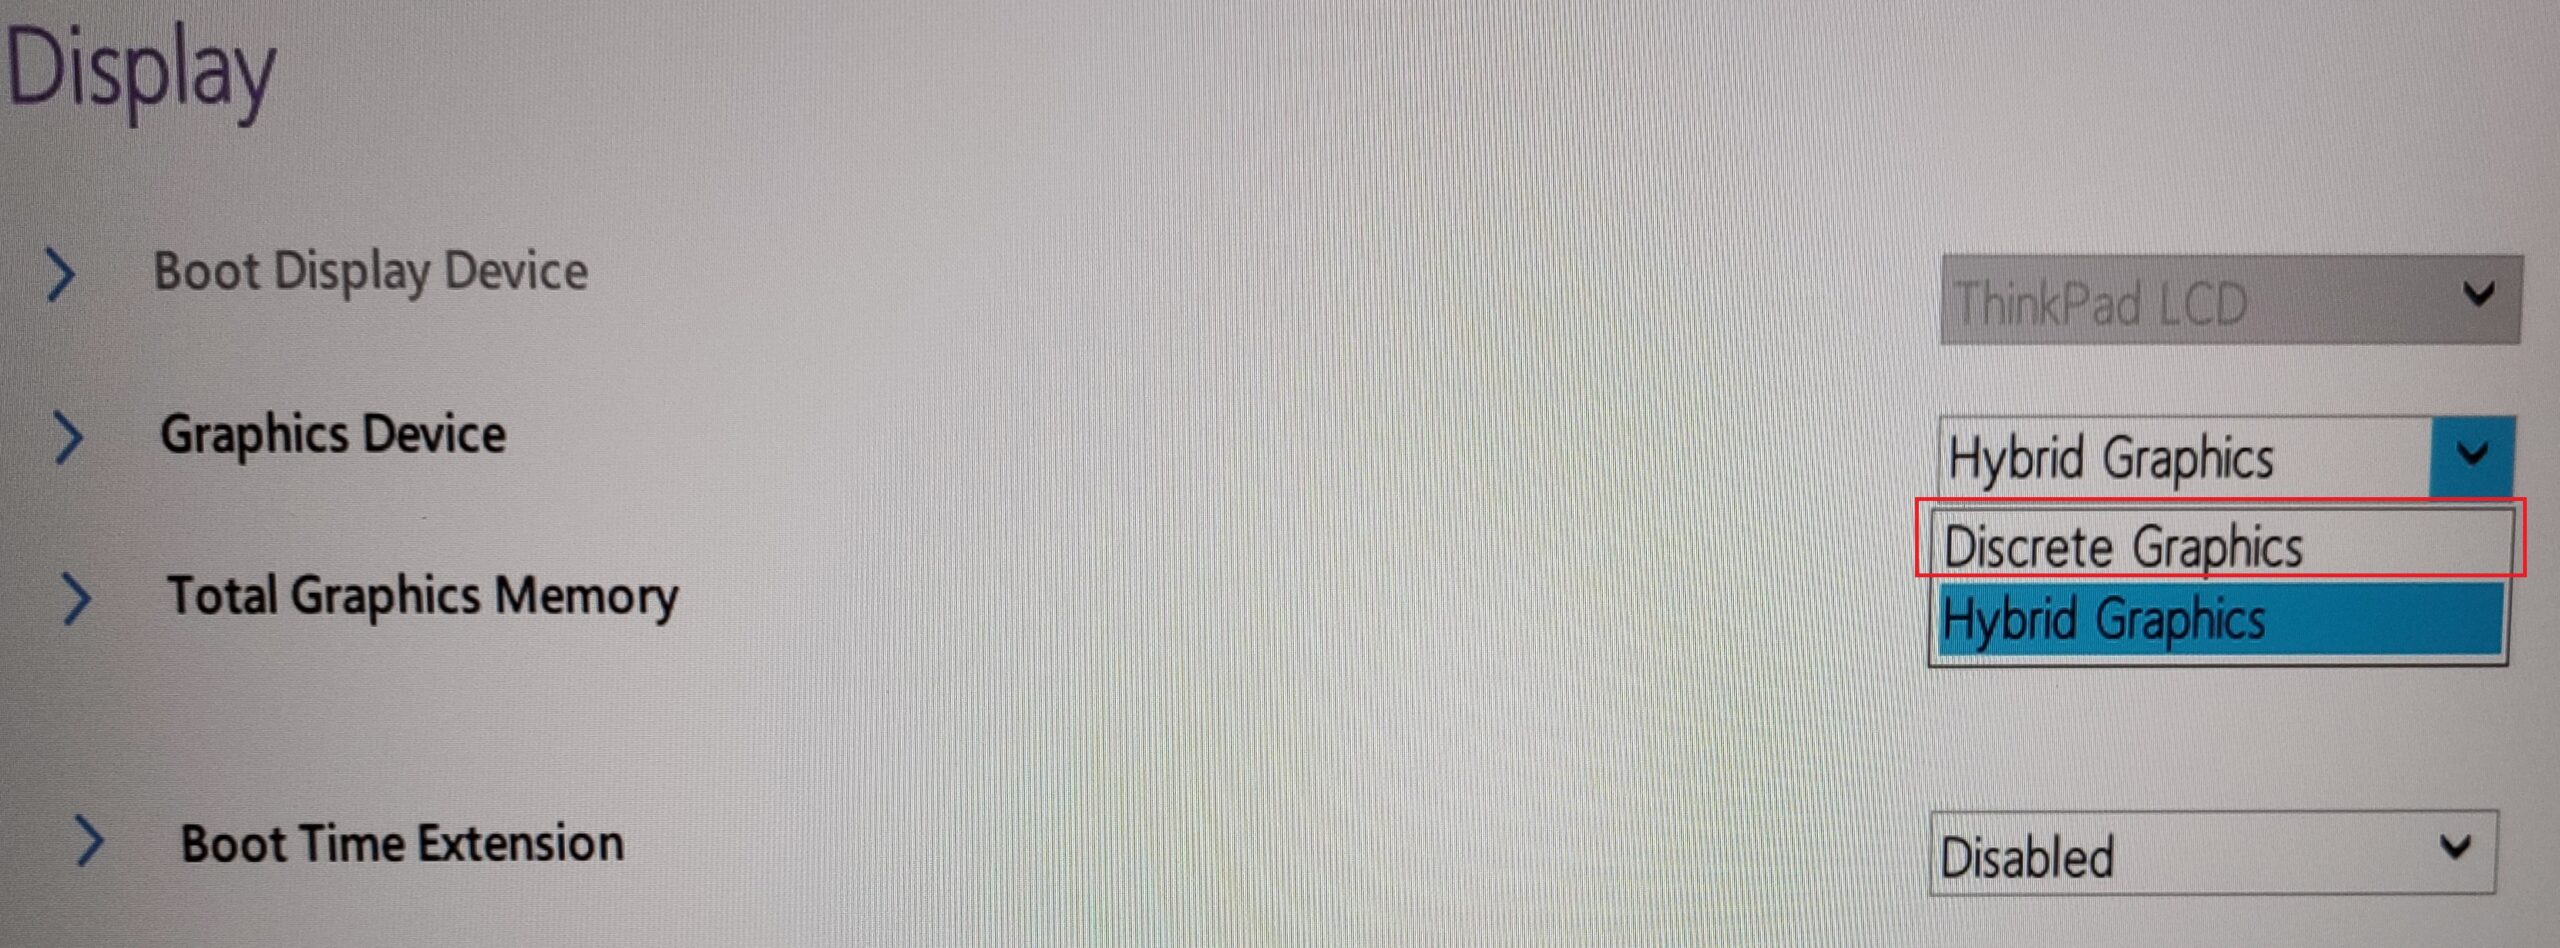
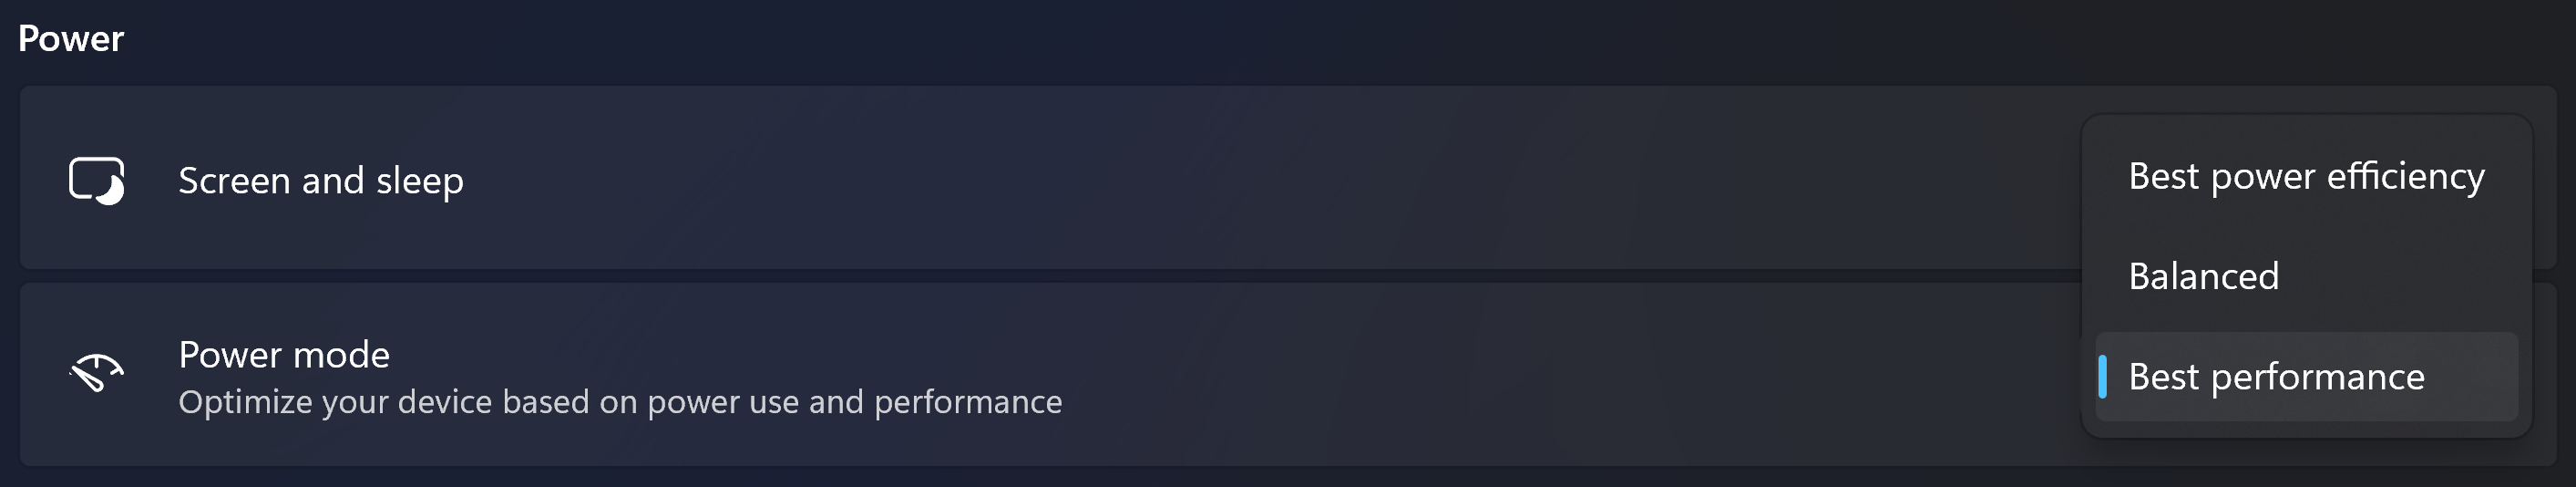
All benchmarks and tests were conducted with the “Best Performance” mode activated (the presets are integrated into the Windows Power mode menu). The “Discrete Graphics” mode is also applied in the BIOS.

CPU options
Three Raptor-Lake CPUs are available – the Core i7-13700H, Core i7-13800H, and Core i9-13900H. We bought a laptop with an i7-13700H since it has the same core count and cache size as the two other chips.
Results are from the Cinebench R23 CPU test (the higher the score, the better)
Results are from our Photoshop benchmark test (the lower the score, the better)
Lenovo ThinkPad P1 Gen 6 CPU variants
Here you can see an approximate comparison between the CPUs that can be found in the Lenovo ThinkPad P1 Gen 6 models on the market. This way you can decide for yourself which Lenovo ThinkPad P1 Gen 6 model is the best bang for your buck.
Note: The chart shows the cheapest different CPU configurations so you should check what the other specifications of these laptops are by clicking on the laptop’s name / CPU.
Results are from the Cinebench R23 CPU test (the higher the score, the better)
Results are from our Photoshop benchmark test (the lower the score, the better)
GPU options
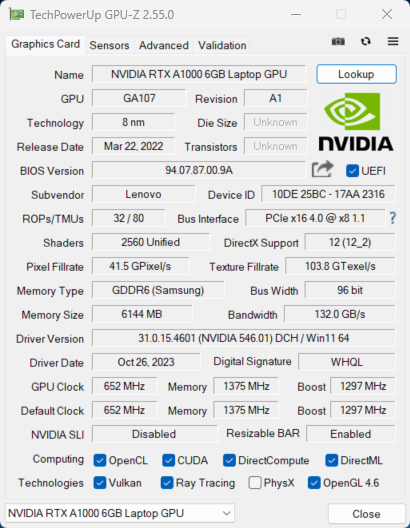
In terms of graphics, you can choose among eight GPU options, five of which are professional RTX variants while the others are standard gaming video cards. So, the options are the following – the NVIDIA RTX A1000 (Laptop, 65W, 6GB), RTX 2000 Ada Generation (35W), RTX 3500 Ada Generation (80W), RTX 4000 Ada Generation (80W), RTX 5000 Ada Generation (80W), GeForce RTX 4060 (Laptop, 80W), GeForce RTX 4080 (Laptop, 80W), and GeForce RTX 4090 (Laptop, 80W).
Results are from the 3DMark: Time Spy (Graphics) benchmark (higher the score, the better)
Results are from the 3DMark: Fire Strike (Graphics) benchmark (higher the score, the better)
Results are from the 3DMark: Wild Life benchmark (higher the score, the better)
Results are from the Unigine Superposition benchmark (higher the score, the better)
Lenovo ThinkPad P1 Gen 6 GPU variants
Here you can see an approximate comparison between the GPUs that can be found in the Lenovo ThinkPad P1 Gen 6 models on the market. This way you can decide for yourself which Lenovo ThinkPad P1 Gen 6 model is the best bang for your buck.
Note: The chart shows the cheapest different GPU configurations so you should check what the other specifications of these laptops are by clicking on the laptop’s name / GPU.
Results are from the 3DMark: Time Spy (Graphics) benchmark (higher the score, the better)
Gaming tests

| Assassin’s Creed Valhalla | Full HD, Low (Check settings) | Full HD, Medium (Check settings) | Full HD, High (Check settings) | Full HD, Ultra (Check settings) |
|---|---|---|---|---|
| Average FPS | 96 fps | 76 fps | 62 fps | 53 fps |

| Borderlands 3 | Full HD, V.Low (Check settings) | Full HD, Medium (Check settings) | Full HD, High (Check settings) | Full HD, Badass (Check settings) |
|---|---|---|---|---|
| Average FPS | 139 fps | 95 fps | 63 fps | 49 fps |

| Far Cry 6 | Full HD, Low (Check settings) | Full HD, High (Check settings) | Full HD, Ultra (Check settings) |
|---|---|---|---|
| Average FPS | 96 fps | 73 fps | 63 fps |

| Gears 5 | Full HD, Low (Check settings) | Full HD, Medium (Check settings) | Full HD, High (Check settings) | Full HD, Ultra (Check settings) |
|---|---|---|---|---|
| Average FPS | 152 fps | 102 fps | 83 fps | 65 fps |
Since the NVIDIA RTX A1000 (Laptop, 65W, 6GB) is based on the GA107 chip, its performance is close to the Geforce RTX 3050 (Laptop) levels. The results are good, the GPU has enough power to deliver more than 60 FPS on High details in the four titles that we have tested.
Max CPU load
In this test we use 100% on the CPU cores, monitoring their frequencies and chip temperature. The first column shows a computer’s reaction to a short load (2-10 seconds), the second column simulates a serious task (between 15 and 30 seconds), and the third column is a good indicator of how good the laptop is for long loads such as video rendering.
Average P-core frequency; Average E-core frequency; CPU temp.; Package Power
| Intel Core i7-13700H (45W TDP) | 0:02 – 0:10 sec | 0:15 – 0:30 sec | 10:00 – 15:00 min |
|---|---|---|---|
| Lenovo ThinkPad P1 Gen 6 | 3.71 GHz @ 2.18 GHz @ 91°C @ 107W | 3.41 GHz @ 2.22 GHz @ 93°C @ 91W | 3.07 GHz @ 2.12 GHz @ 88°C @ 72W |
| Lenovo ThinkBook 16p Gen 4 | 3.94 GHz @ 3.04 GHz @ 75°C @ 114W | 3.88 GHz @ 3.03 GHz @ 85°C @ 110W | 2.88 GHz @ 2.95 GHz @ 83°C @ 95W |
| HP ZBook Power G10 | 2.93 GHz @ 2.16 GHz @ 62°C @ 54W | 2.98 GHz @ 2.14GHz @ 68°C @ 54W | 2.46 GHz @ 1.99 GHz @ 79°C @ 45W |
| HP ZBook Studio 16 G10 | 3.50 GHz @ 2.91 GHz @ 72°C @ 88W | 3.49 GHz @ 2.88 GHz @ 87°C @ 88W | 2.96 GHz @ 2.45 GHz @ 81°C @ 60W |
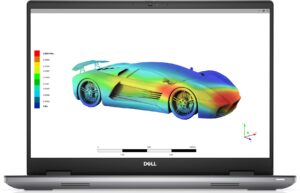
| Dell XPS 15 9530 | 3.28 GHz @ 2.57 GHz @ 94°C @ 85W | 2.95 GHz @ 2.20 GHz @ 95°C @ 65W | 2.51 GHz @ 1.90 GHz @ 82°C @ 45W |
| MSI Stealth 16 Studio (A13V) | 3.77 GHz @ 2.34 GHz @ 87°C @ 101W | 3.61 GHz @ 2.32 GHz @ 87°C @ 91W | 3.62 GHz @ 2.43 GHz @ 87°C @ 92W |
| Acer Nitro 17 (AN17-51) “Turbo” preset | 3.91 GHz @ 2.93 GHz @ 66°C @ 115W | 3.90 GHz @ 2.93 GHz @ 76°C @ 115W | 3.70 GHz @ 2.85 GHz @ 76°C @ 100W |
| Acer Nitro 17 (AN17-51) “Performance” preset | 3.92 GHz @ 2.95 GHz @ 70°C @ 115W | 3.89 GHz @ 2.93 GHz @ 81°C @ 115W | 3.34 GHz @ 2.61 GHz @ 74°C @ 80W |
| Acer Nitro 16 (AN16-51) | 3.08 GHz @ 3.10 GHz @ 68°C @ 115W | 3.59 GHz @ 3.04 GHz @ 79°C @ 115W | 3.53 GHz @ 2.94 GHz @ 81°C @ 100W |
| Acer Swift X 14 (SFX14-71G) | 1.36 GHz @ 3.23 GHz @ 80°C @ 80W | 0.40 GHz @ 1.95 GHz @ 54°C @ 20W | 0.60 GHz @ 3.16 GHz @ 83°C @ 50W |
| Acer Swift Go 14 (SFG14-71) | 3.13 GHz @ 2.34 GHz @ 75°C @ 67W | 3.08 GHz @ 2.32 GHz @ 91°C @ 66W | 2.46 GHz @ 1.83 GHz @ 89°C @ 43W |
| MSI Pulse 15 (B13V) | 3.70 GHz @ 2.36 GHz @ 86°C @ 96W | 3.52 GHz @ 2.37 GHz @ 87°C @ 89W | 3.23 GHz @ 2.54 GHz @ 77°C @ 87W |
| MSI Vector GP77 | 3.86 GHz @ 3.08 GHz @ 89°C @ 135W | 3.75 GHz @ 3.10 GHz @ 94°C @ 128W | 3.24 GHz @ 3.00 GHz @ 81°C @ 90W |
Let’s see how good the cooling is compared to the other business laptops in the table above. First of all, the Core i7-13700H in this notebook can maintain a high P core clock and decent E core frequency no matter the load. The temperatures are on the high side. Still, the ThinkPad P1 Gen 6 is definitely ahead of the HP ZBook Power G10 and Dell XPS 15 9530. The Lenovo ThinkBook 16p Gen 4 and HP ZBook Studio 16 G10 are doing a better job under any kind of stress except for longer tasks where the P1 Gen 6 can show a bit higher P core frequency.
Real-life gaming
| NVIDIA RTX A1000 | GPU frequency/ Core temp (after 2 min) | GPU frequency/ Core temp (after 30 min) |
|---|---|---|
| Lenovo ThinkPad P1 Gen 6 | 1628 MHz @ 77°C @ 62W | 1662 MHz @ 78°C @ 65W |
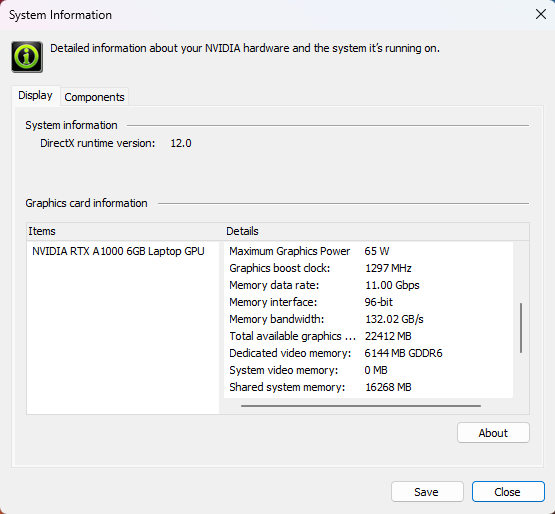
Interestingly, Lenovo mentions a TGP of 35W for the NVIDIA RTX A1000 (Laptop) but the NVIDIA Control Panel shows a value of 65W. This seems valid after 30 minutes of gaming and the temperatures are also under control.
Comfort during full load
The power presets are integrated into the Windows performance slider. The keyboard feels a bit warm in the center when the hardware under the bonnet is stressed but the outside thermals are okay for usage.
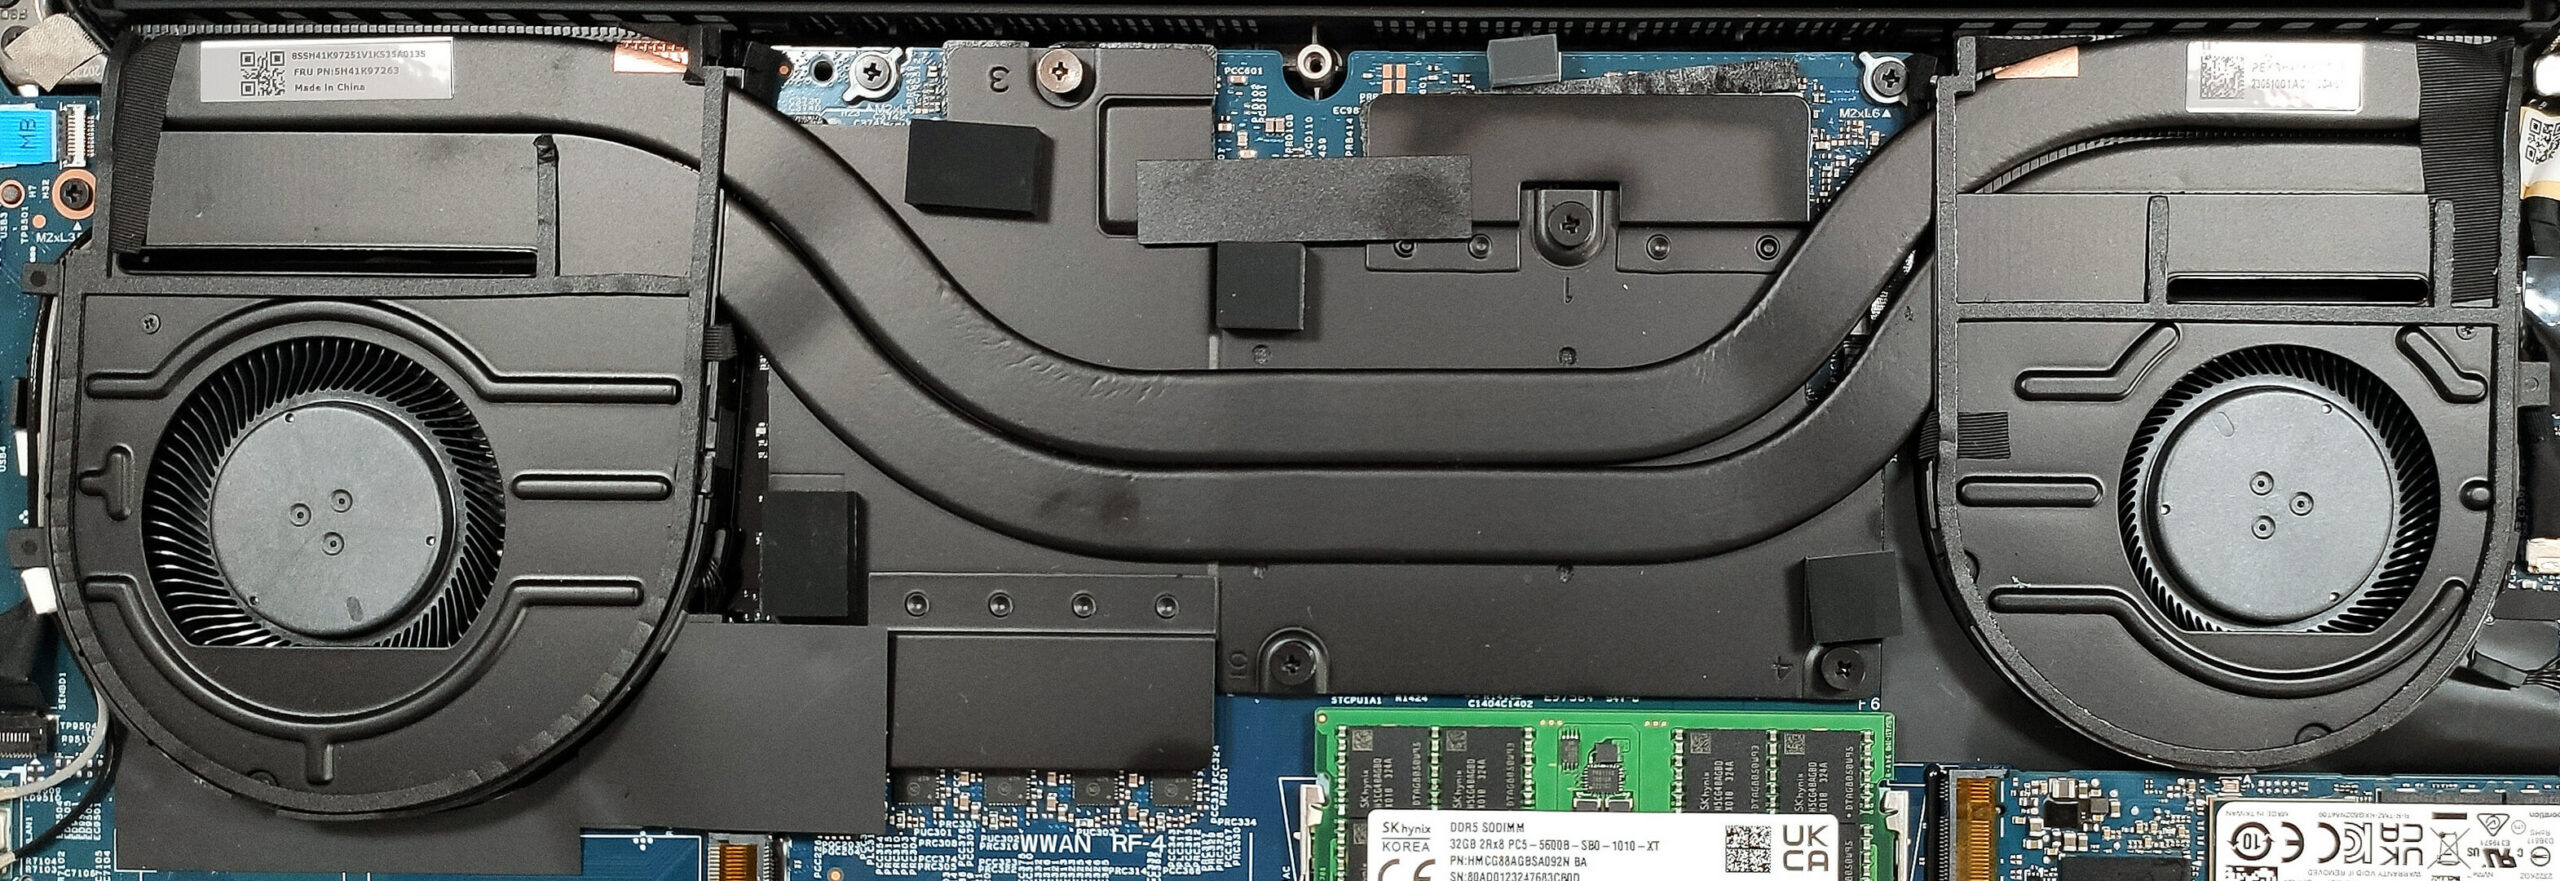
The two fans aren’t noisy when the CPU is pounded with heavy loads. In idle, the fan speed is ~2400 RPM while it’s ~4500 RPM in longer stress.
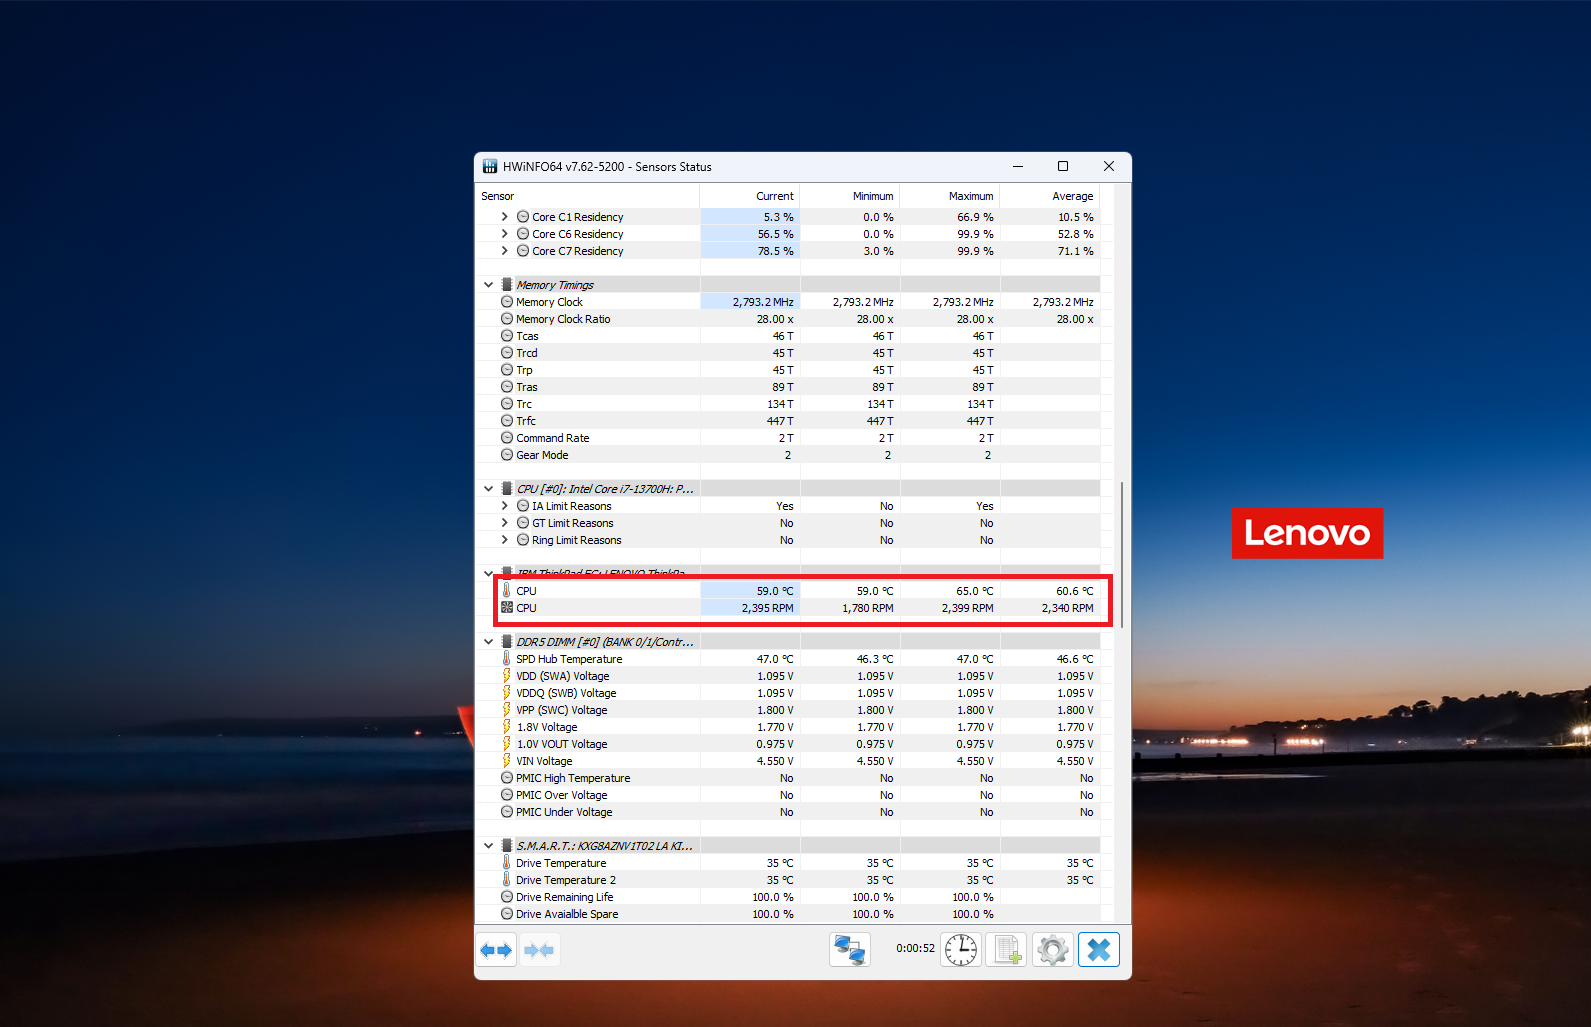 Idle
Idle Max CPU load
Battery
Now, we conduct the battery tests with the Windows Better performance setting turned on, screen brightness adjusted to 120 nits and all other programs turned off except for the one we are testing the notebook with. The 90.1Wh battery lasts for 14 hours and 17 minutes of Web browsing, or 10 hours of video playback. A good result.
In order to simulate real-life conditions, we used our own script for automatic web browsing through over 70 websites.

For every test like this, we use the same video in HD.


Naprawdę brak numpada to wada ? Wielu głównie dla tego kupi p1 bo inne wersje maja num pad i przesunięty touchpad … co wg. wielu jest slabe.