Apple M5 vs M4, M3, M2, M1 (+Pro/Max/Ultra): Full Comparison!
Apple has ingeniously designed its M-series CPUs to function like legos, allowing them to pair up and create more formidable chips. For instance, the M-Ultra chips are essentially two M-Max CPUs combined, effectively doubling their resources to challenge every Intel and AMD CPU. However, today’s focus isn’t on Team Blue and Team Red; instead, we’re comparing all four generations of M-series processors.
Additionally, we’ll provide projected scores for the Apple M5 Pro, M5 Max, and M5 Ultra, and of course for the missing M4 Ultra. Let’s go!
[01/2025] Updated: Added Apple M4 (8-core CPU), M4 (10-core CPU), M4 Pro (12-core CPU), M4 Pro (14-core CPU), M4 Max (14-core CPU), and M4 Max (16-core CPU)
[03/2025] Updated: Added Apple M3 Ultra
[11/2025] Updated: Added Apple M5 (9-core and 10-core)
[03/2026] Updated: Added A18 Pro, Apple M5 Pro (15-core and 18-core), and Apple M5 Max
Apple CPU lineup – The Full List
Each new generation of Apple chips brings significant upgrades, as Apple introduces more powerful and efficient architectures annually:
| Apple SoC | Super / Performance / Efficiency Cores | GPU Cores | Memory Bandwidth | Transistors |
| Apple M5 Max (18-core CPU, 40c GPU) | 6S+12P | 40 | 614 GB/s | — |
| Apple M5 Max (18-core CPU, 32c GPU) | 6S+12P | 32 | 460 GB/s | — |
| Apple M5 Pro (18-core CPU) | 6S+12P | 20 | 307 GB/s | — |
| Apple M5 Pro (15-core CPU) | 5S+10P | 16 | 307 GB/s | — |
| Apple M5 (10-core CPU) | 4P+6E | 10 | 153 GB/s | — |
| Apple A18 Pro (MacBook Neo) | 2P+4E | 5 | 60 GB/s | — |
| Apple M5 (9-core CPU) | 3P+6E | 10 | 153 GB/s | — |
| Apple M4 Max (16-core CPU) | 12P+4E | 40 | 546 GB/s | — |
| Apple M4 Max (14-core CPU) | 10P+4E | 32 | 410 GB/s | — |
| Apple M4 Pro (14-core CPU) | 10P+4E | 20 | 273 GB/s | — |
| Apple M4 Pro (12-core CPU) | 8P+4E | 16 | 273 GB/s | — |
| Apple M4 (10-core CPU) | 4P+6E | 10 | 120 GB/s | 28 billion |
| Apple M4 (9-core CPU) | 3P+6E | 8 | 120 GB/s | 28 billion |
| Apple M4 (8-core CPU) | 4P+4E | 8 | 120 GB/s | 28 billion |
| Apple M3 Ultra (32-core CPU) | 24P+8E | 80 | 819.3 GB/s | 184 billion |
| Apple M3 Ultra (28-core CPU) | 20P+8E | 60 | 819.3 GB/s | 184 billion |
| Apple M3 Max (16-core CPU) | 12P+4E | 30 or 40 | 408.6 GB/s | 92 billion |
| Apple M3 Max (14-core CPU) | 10P+4E | 30 or 40 | 307.2 GB/s | 92 billion |
| Apple M3 Pro (12-core CPU) | 6P+6E | 14 or 16 | 153.6 GB/s | 37 billion |
| Apple M3 Pro (11-core CPU) | 5P+6E | 14 or 16 | 153.6 GB/s | 37 billion |
| Apple M3 (8-core CPU) | 4P+4E | 8 or 10 | 102.4 GB/s | 25 billion |
| Apple M2 Ultra (24-core CPU) | 16P+8E | 60 or 76 | 819.2 GB/s | 134 billion |
| Apple M2 Max (12-core CPU) | 8P+4E | 30 or 38 | 409.6 GB/s | 67 billion |
| Apple M2 Pro (12-core CPU) | 6P+4E | 16 or 19 | 204.8 GB/s | 40 billion |
| Apple M2 Pro (10-core CPU) | 6P+4E | 16 or 19 | 204.8 GB/s | 40 billion |
| Apple M2 (8-core CPU) | 4P+4E | 8 or 10 | 102.4 GB/s | 20 billion |
| Apple M1 Ultra (20-core CPU) | 16P+4E | 64 | 819.2 GB/s | 114 billion |
| Apple M1 Max (10-core CPU) | 8P+2E | 24 or 32 | 409.6 GB/s | 57 billion |
| Apple M1 Pro (10-core CPU) | 8P+2E | 16 | 204.8 GB/s | 33.7 billion |
| Apple M1 Pro (8-core CPU) | 6P+2E | 14 | 204.8 GB/s | 33.7 billion |
| Apple M1 (8-core CPU) | 4P+4E | 7 or 8 | 68.3 GB/s | 16 billion |
Apple M1 vs M2 vs M3 vs M4 vs M5
First, let’s examine the progression of the “base” variant of the M-series CPUs.
Below is a summary of the single-core performance for these base variants, showcasing performance scores and percentage improvements across successive generations.
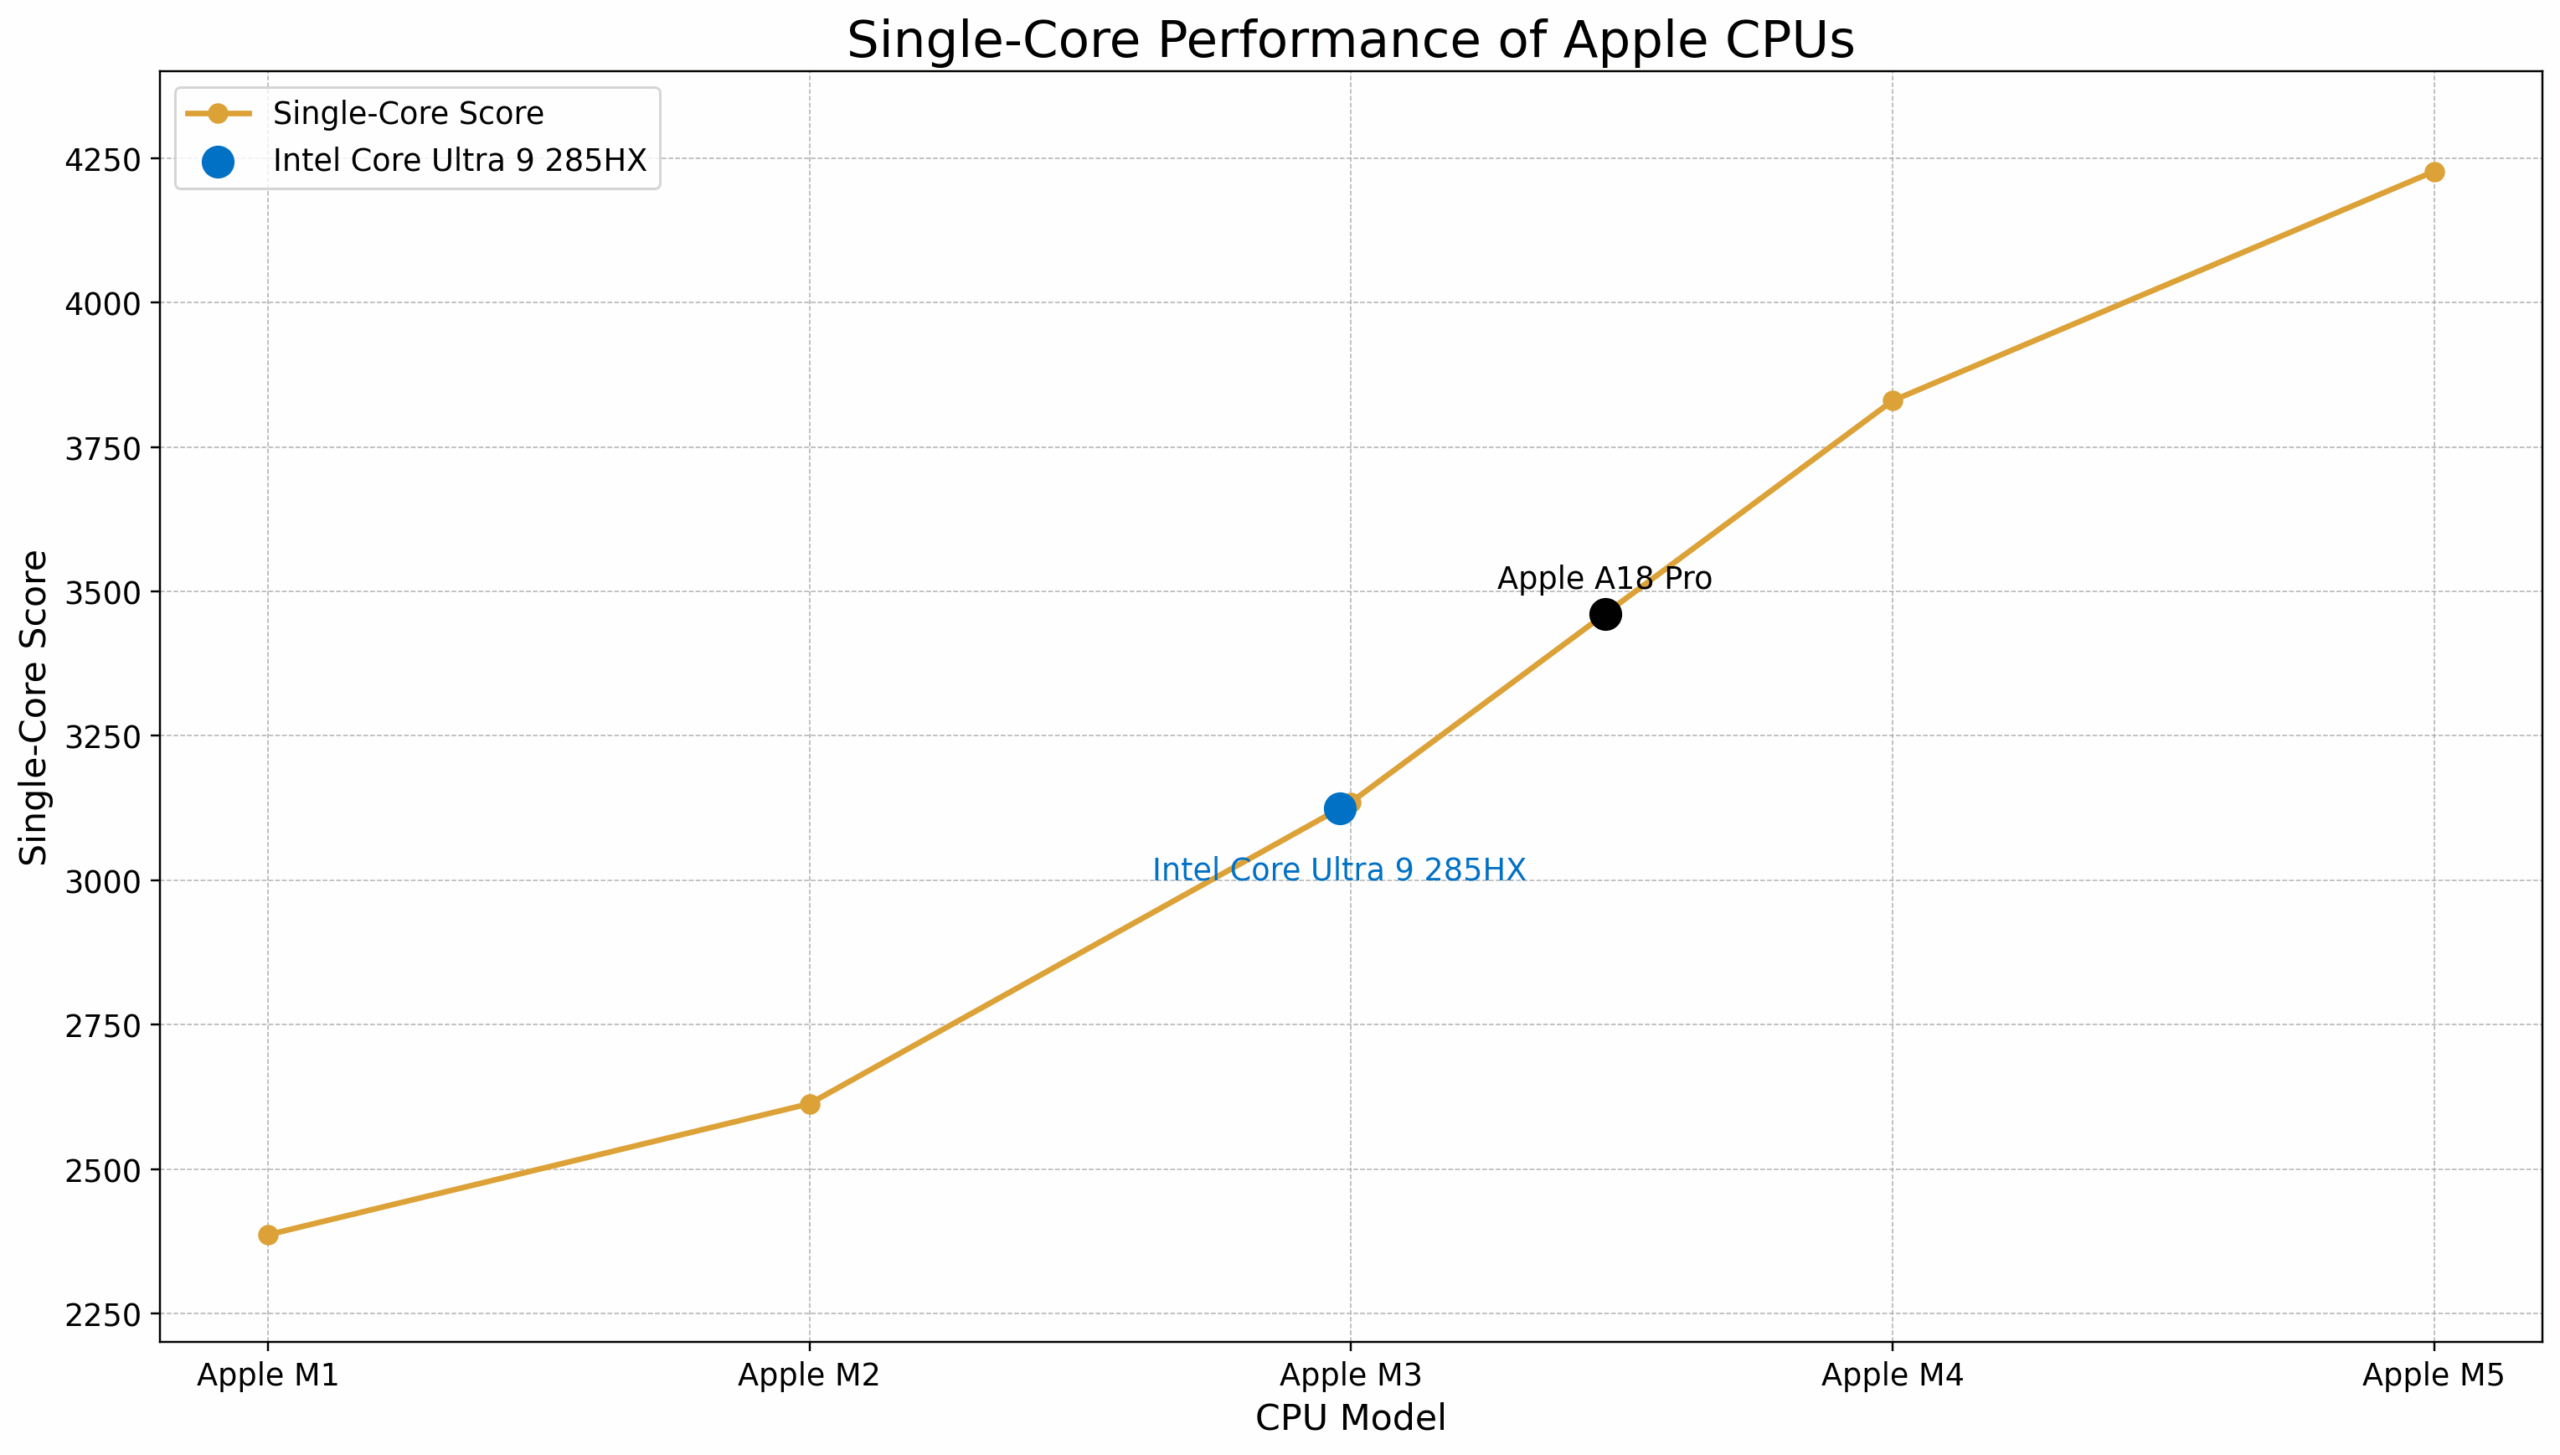
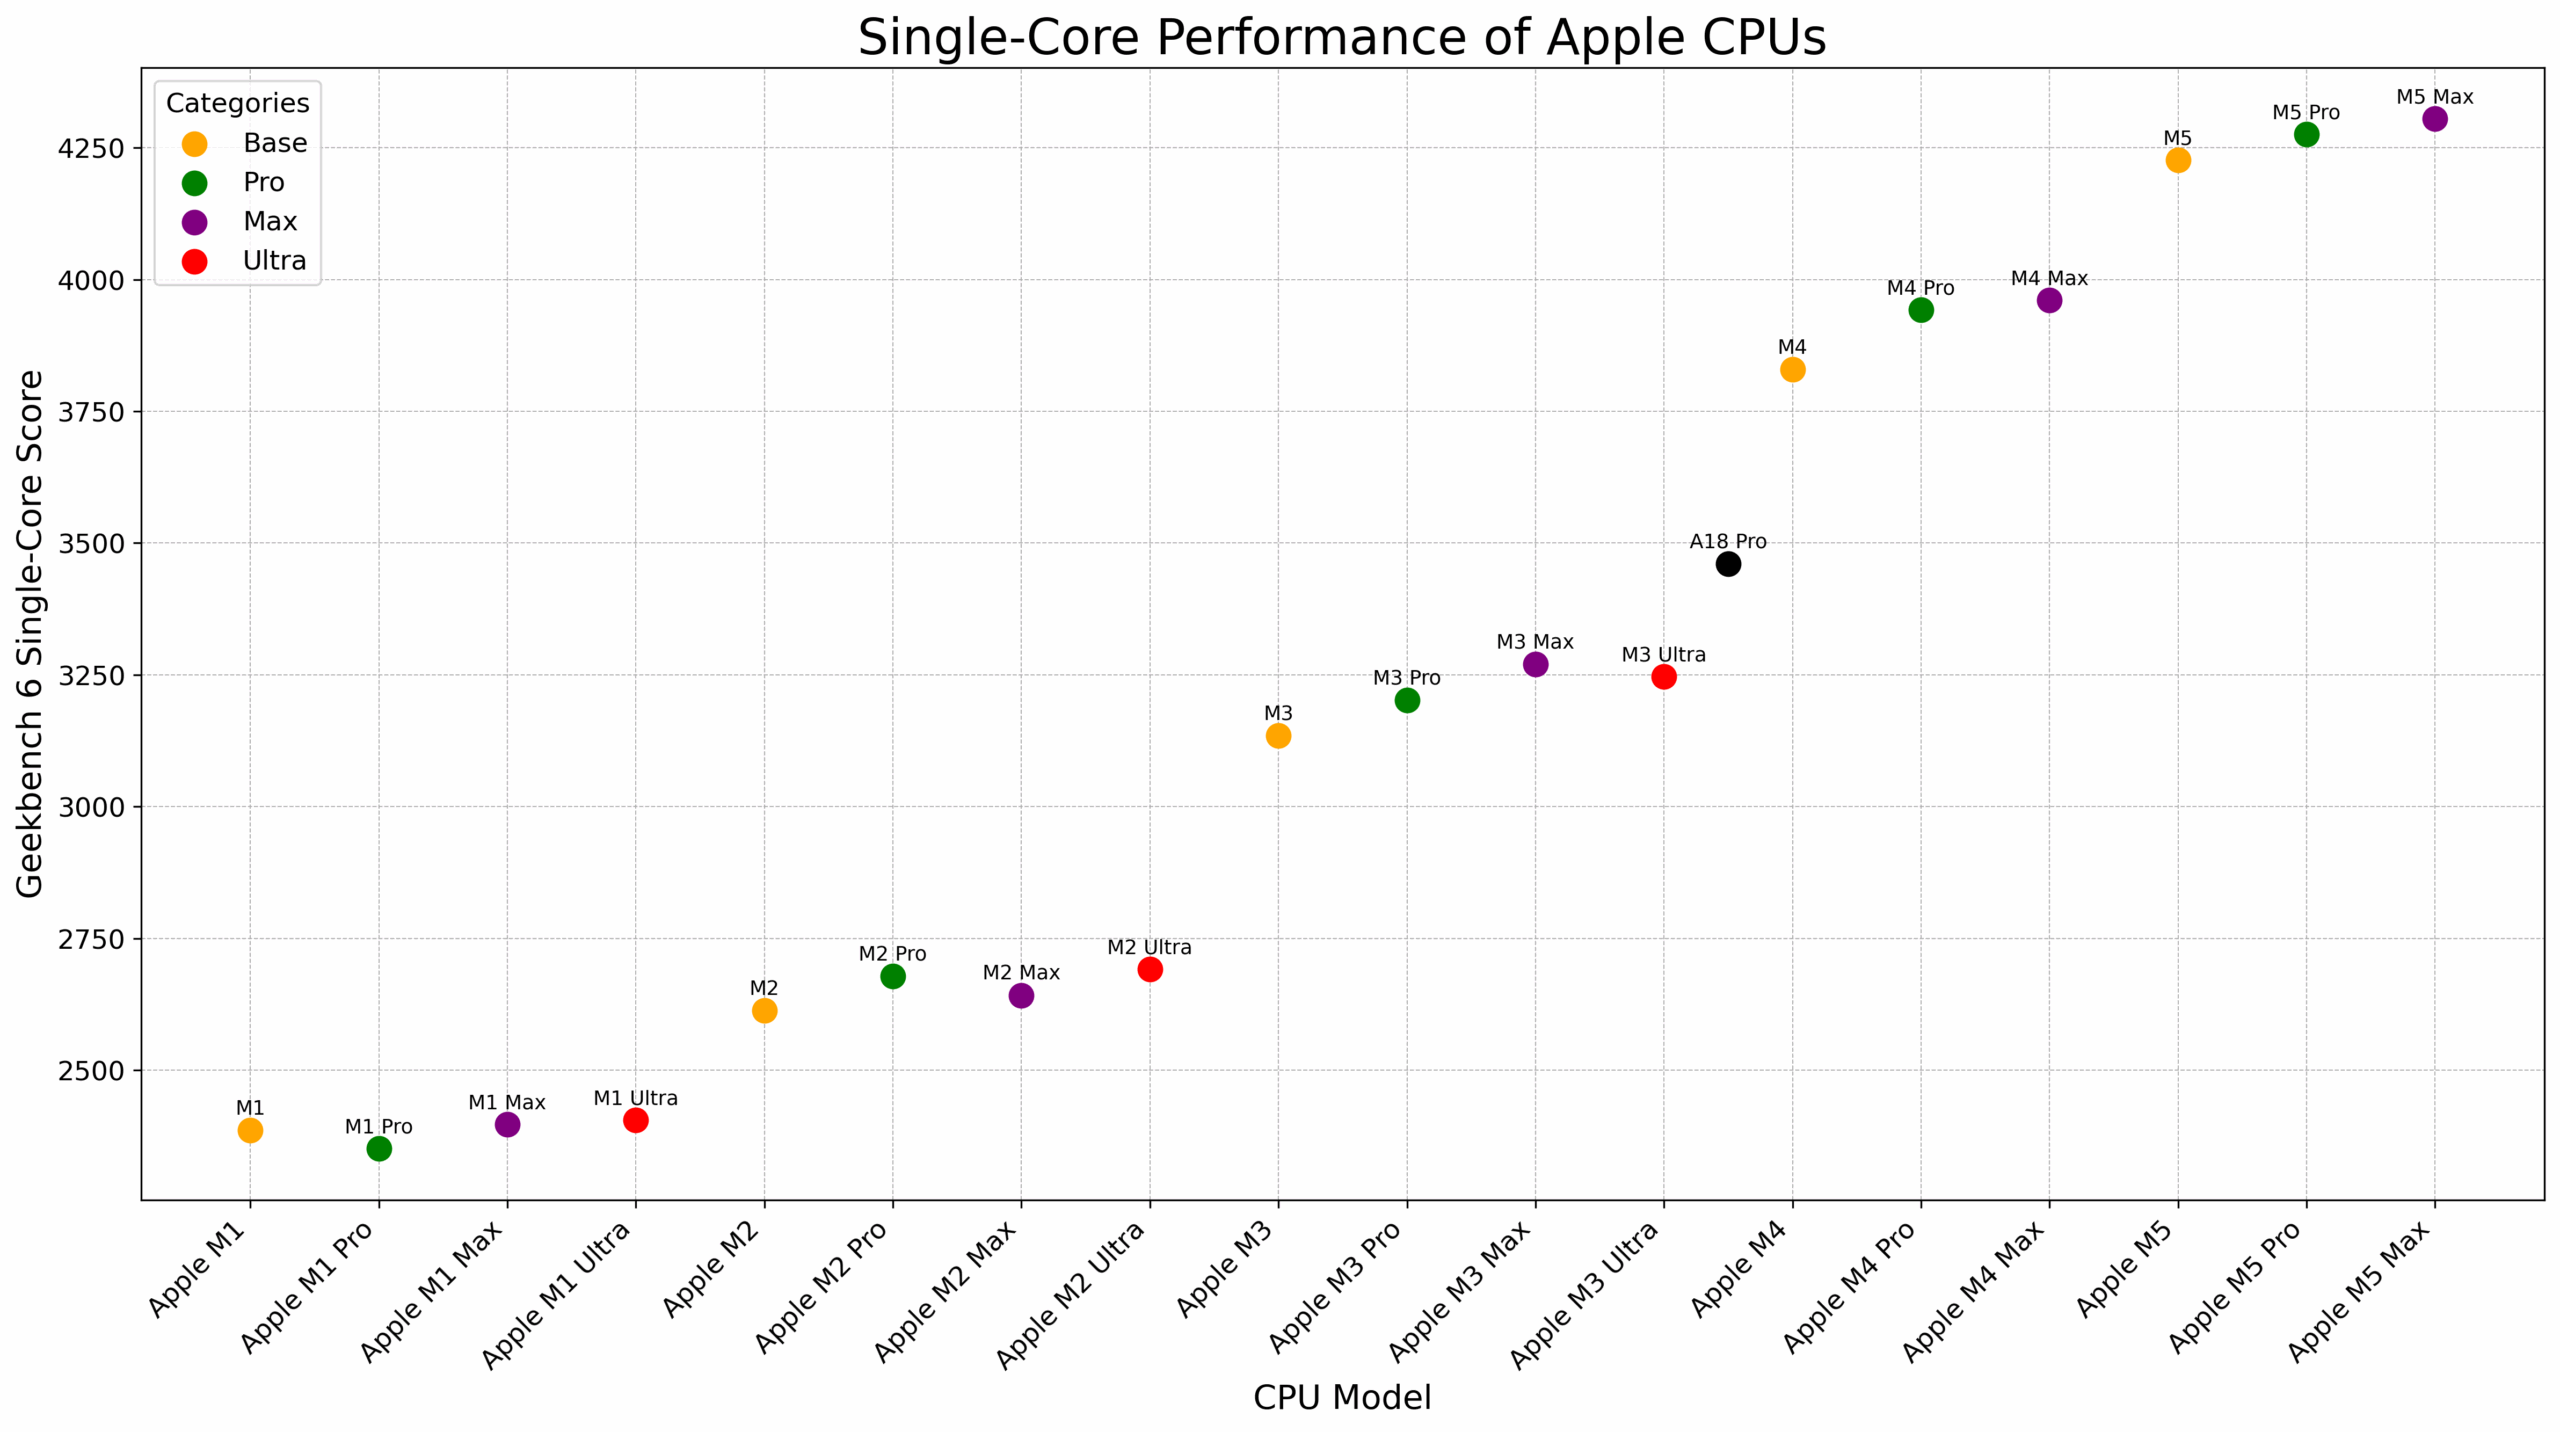
Single-Core Performance
Single-core performance is pivotal for delivering optimal speed in applications that depend heavily on the processor’s core speed, such as gaming or software compilation. It also plays a significant role in determining the overall responsiveness and efficiency of operating systems and utility applications, ensuring smooth user experiences even when multi-core optimization is not available.
We’re adding the best-performing Intel chip in our Top Laptop CPU Ranking, the Intel Core Ultra 9 285HX (3124 points), for reference. It almost perfectly aligns with Apple M3. The Apple A18 Pro in MacBook Neo is just between M3 and M4.
| CPU | Geekbench 6 Single-Core | Performance Jump (%) |
| Apple M1 | 2386 | — |
| Apple M2 | 2613 | +10% |
| Apple M3 | 3135 | +20% |
| Apple A18 Pro (MacBook Neo) | 3461 | — |
| Apple M4 | 3830 | +22% |
| Apple M5 | 4227 | +10% |
| Average performance jump: +16% | ||
The Apple M4 represents the most significant leap yet in single-core performance.
There are also two “trimmed” variants of M4 – the 8-core Apple M4 that can be found in the most budget iMac, and the 9-core Apple M4 that can be found in the most budget iPad Pro:
| CPU | Geekbench 6 Single-Core | Performance Jump (%) |
| Apple M4 (8-core, iMac) | 3650 | |
| Apple M4 (9-core, iPad) | 3671 | +0.5% |
| Apple M4 (10-core, MacBook Pro) | 3830 | +4% |
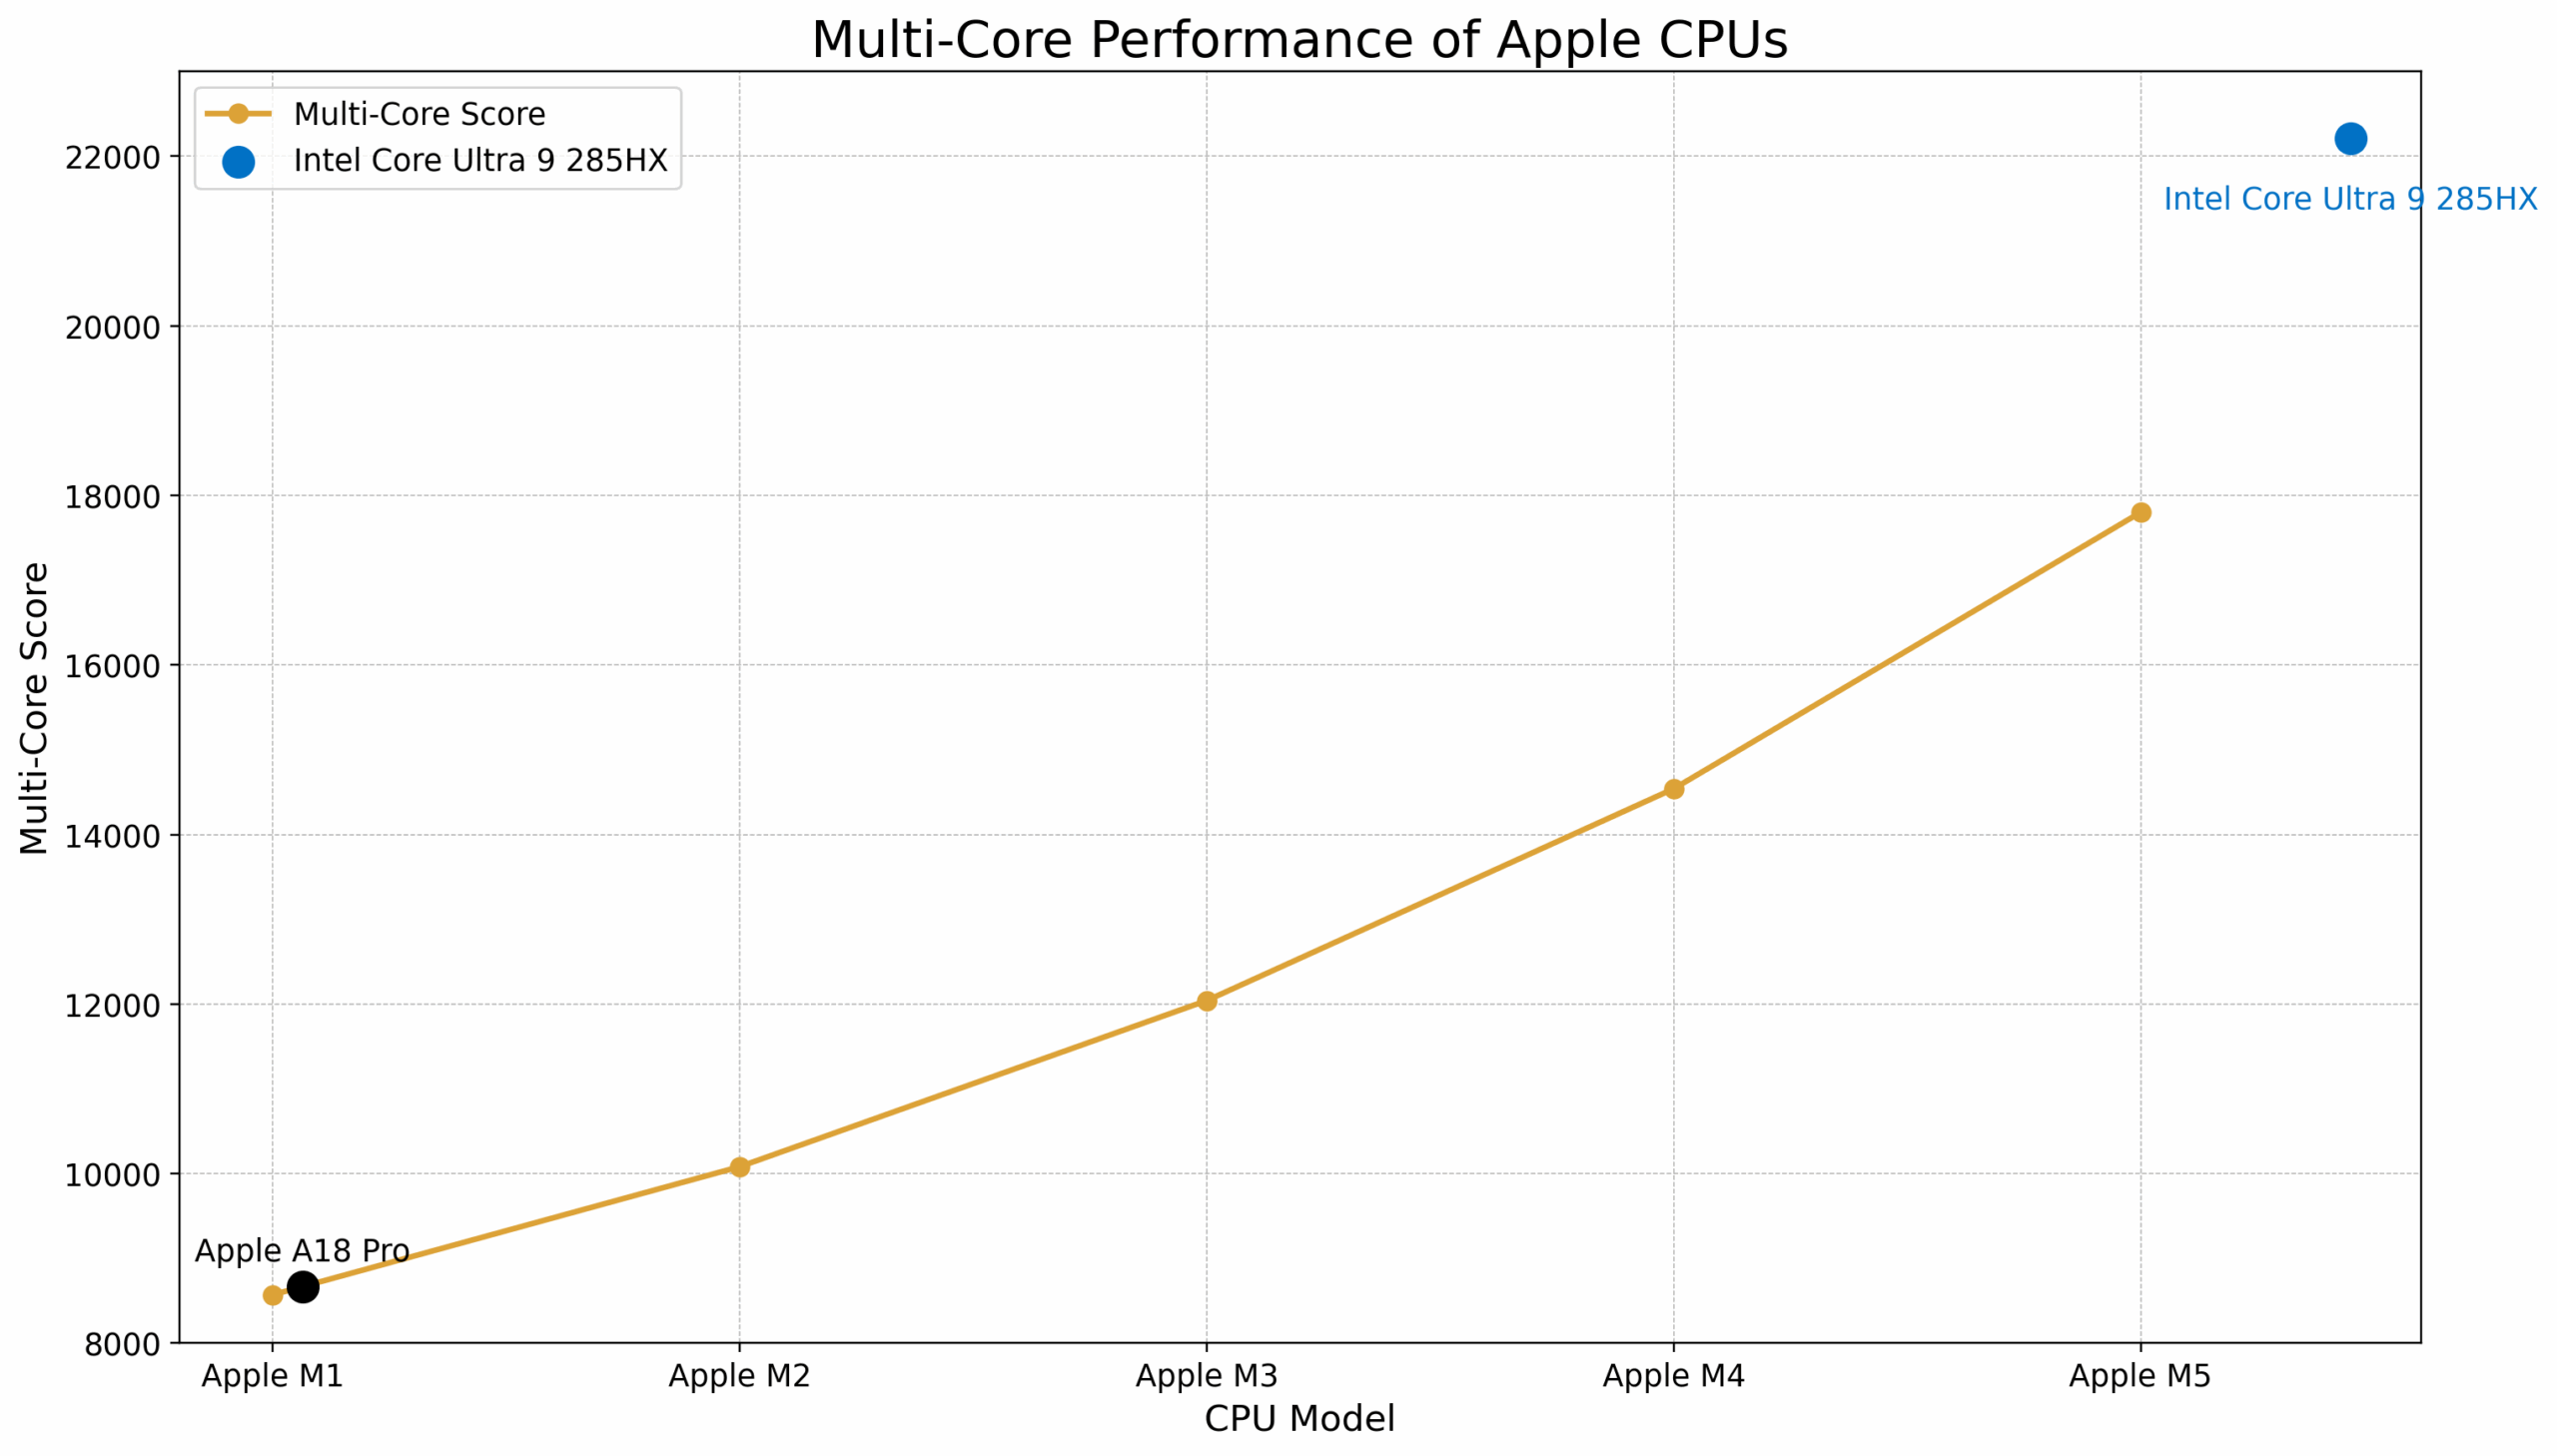
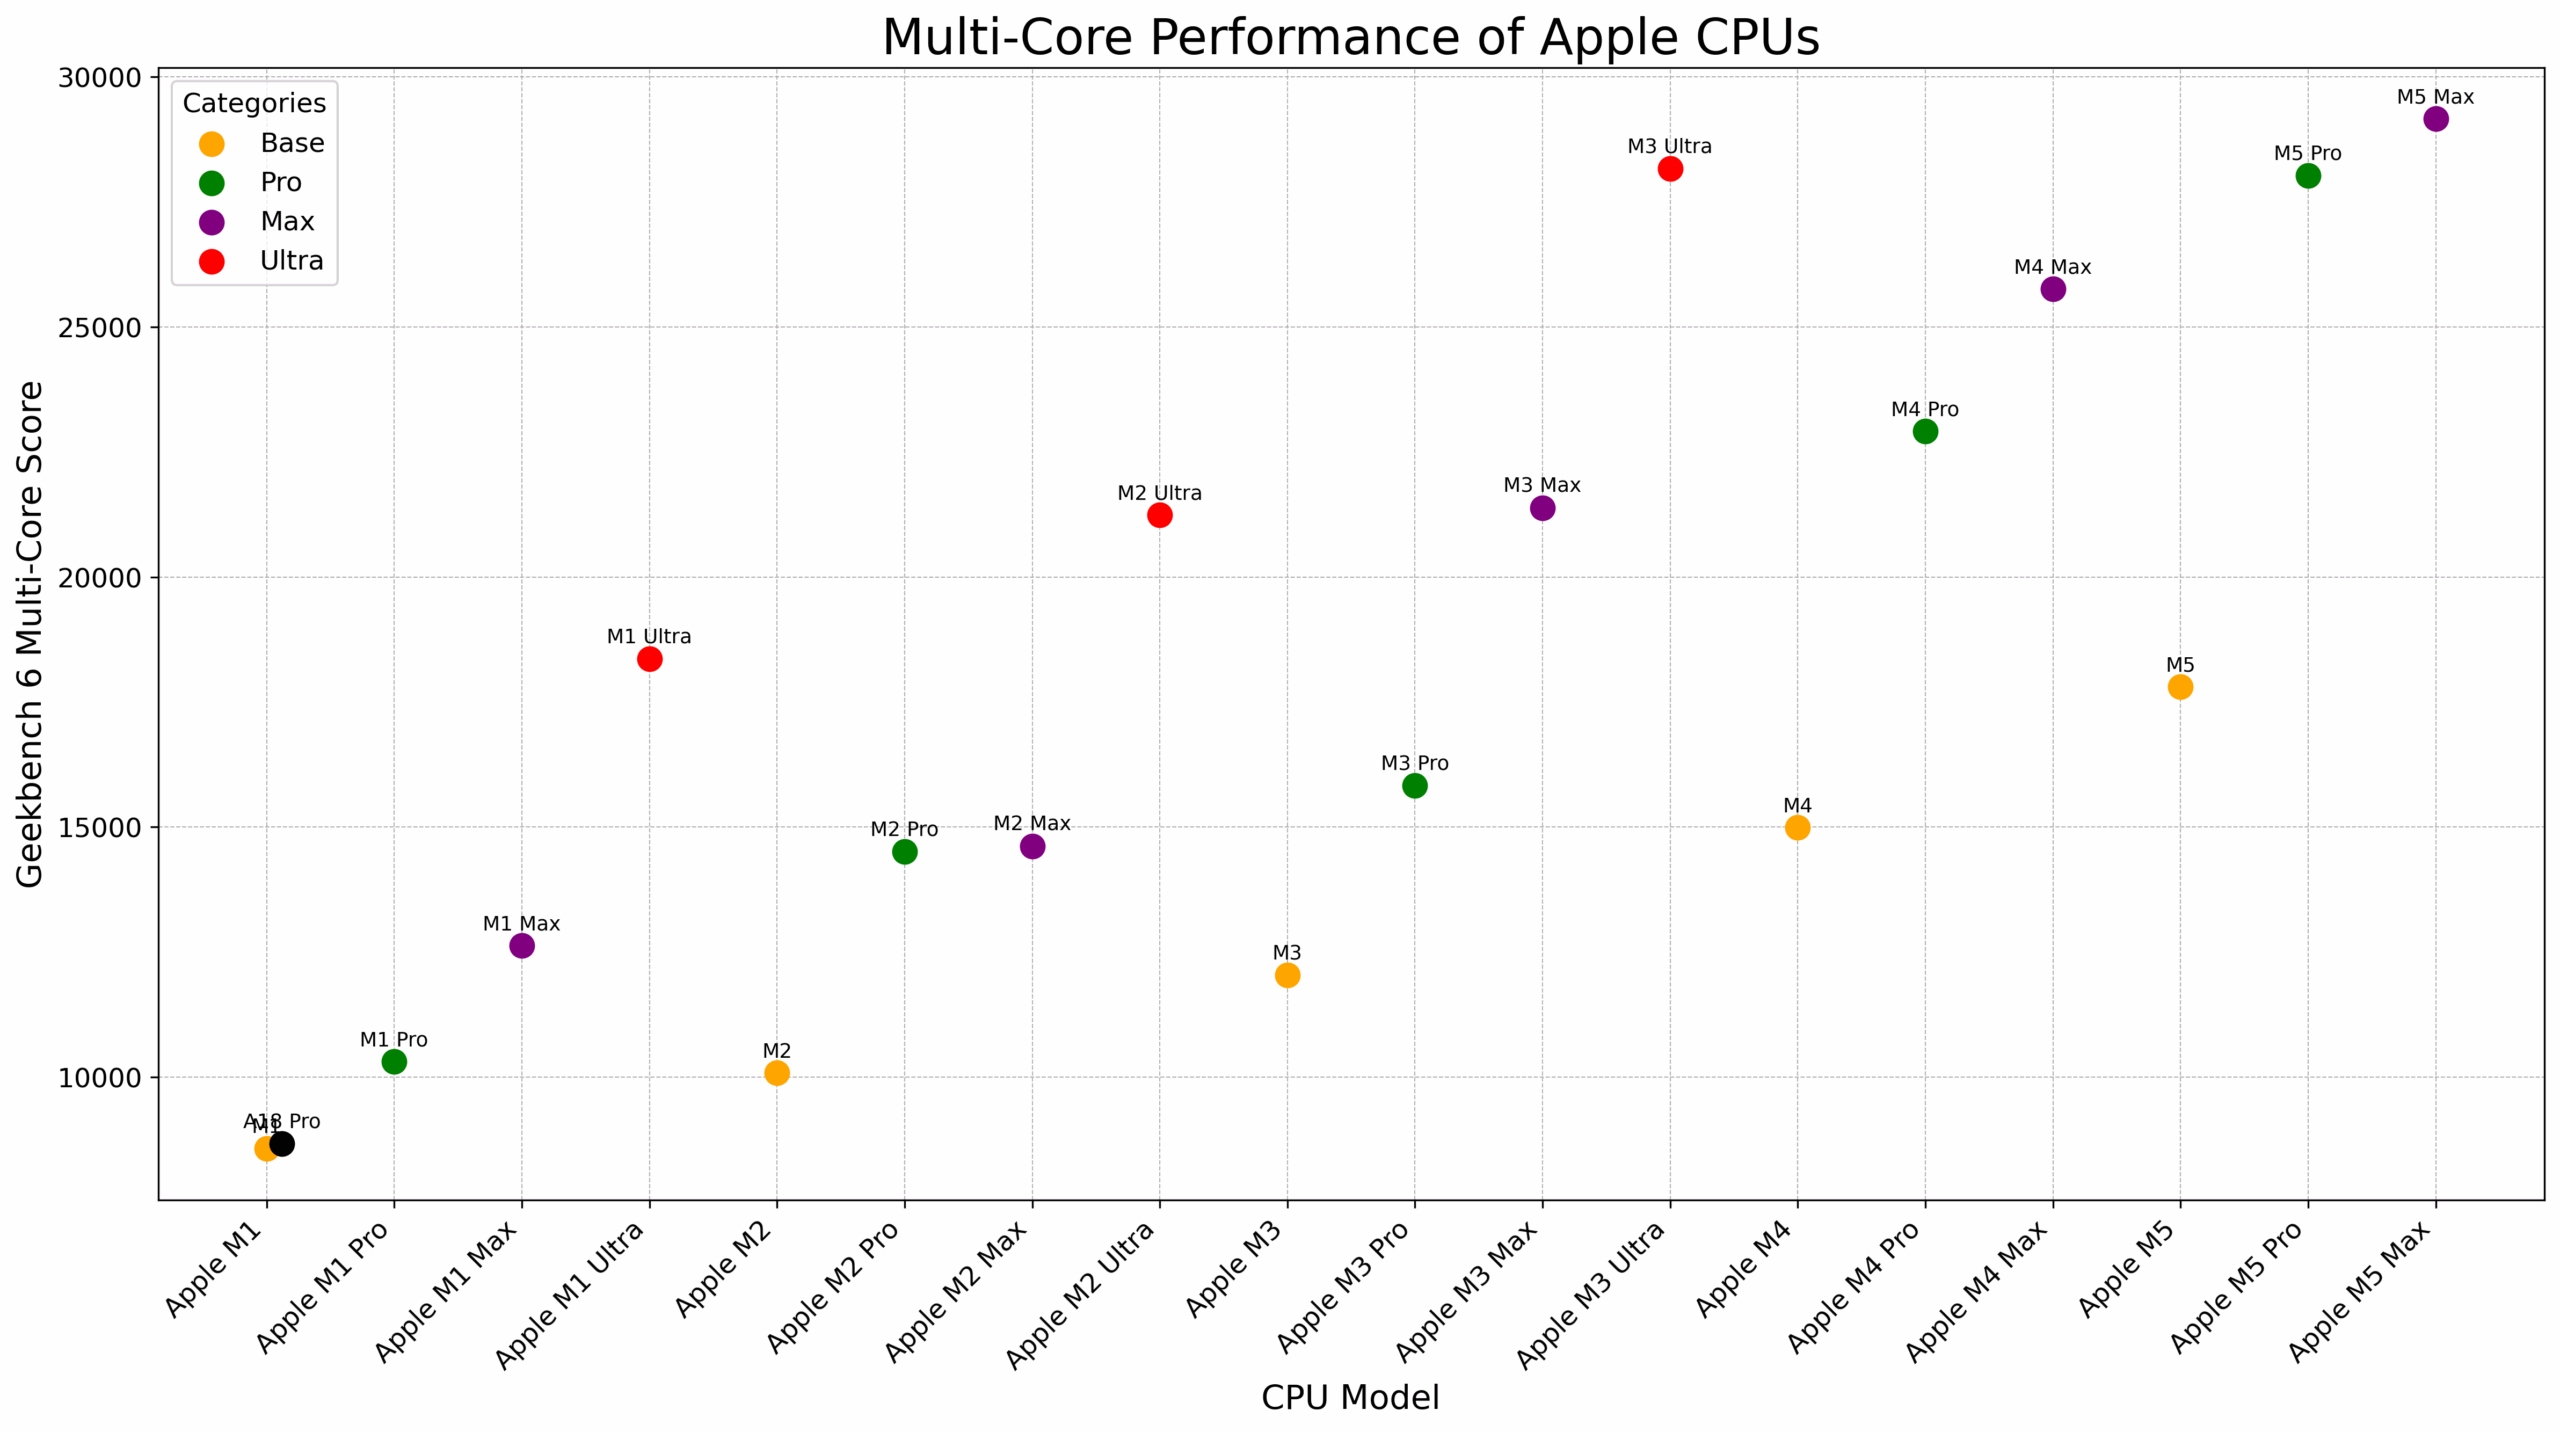
Multi-Core Performance
Multi-core performance is essential for handling complex and demanding tasks, such as video editing, 3D rendering, and scientific simulations.
The table below details the multi-core performance of Apple’s base M-series CPUs, highlighting score improvements and performance gains with each new generation. For context, we’ve added the top-performing Intel chip in our Top Laptop CPU Ranking, the Intel Core Ultra 9 285HX, which scores 22215 points.
The Apple A18 Pro in MacBook Neo is just above the Apple M1 chip.
| CPU | Geekbench 6 Multi-Core | Performance Jump (%) |
| Apple M1 | 8571 | — |
| Apple A18 Pro (MacBook Neo) | 8668 | — |
| Apple M2 | 10082 | +18% |
| Apple M3 | 12042 | +19% |
| Apple M4 | 14541 | +21% |
| Apple M5 | 17802 | +22% |
| Average performance jump: +20% | ||
Multi-core performance trends closely with single-core improvements, with the latest M5 marking the most substantial advancement. However, the base variants still trail behind the Intel flagship, Core Ultra 9 285HX, in complex tasks.
Again, here’s a M4 variants comparison:
| CPU | Performance Cores | Geekbench 6 Multi-Core | Performance Jump (%) |
| Apple M4 (9-core, iPad) | 3 | 13 381 | |
| Apple M4 (8-core, iMac) | 4 | 13 836 | +3% |
| Apple M4 (10-core, MacBook Pro) | 4 | 14 990 | +8% |
Now, let’s compare this to the Pro, Max, and Ultra variants of the Apple M-series.
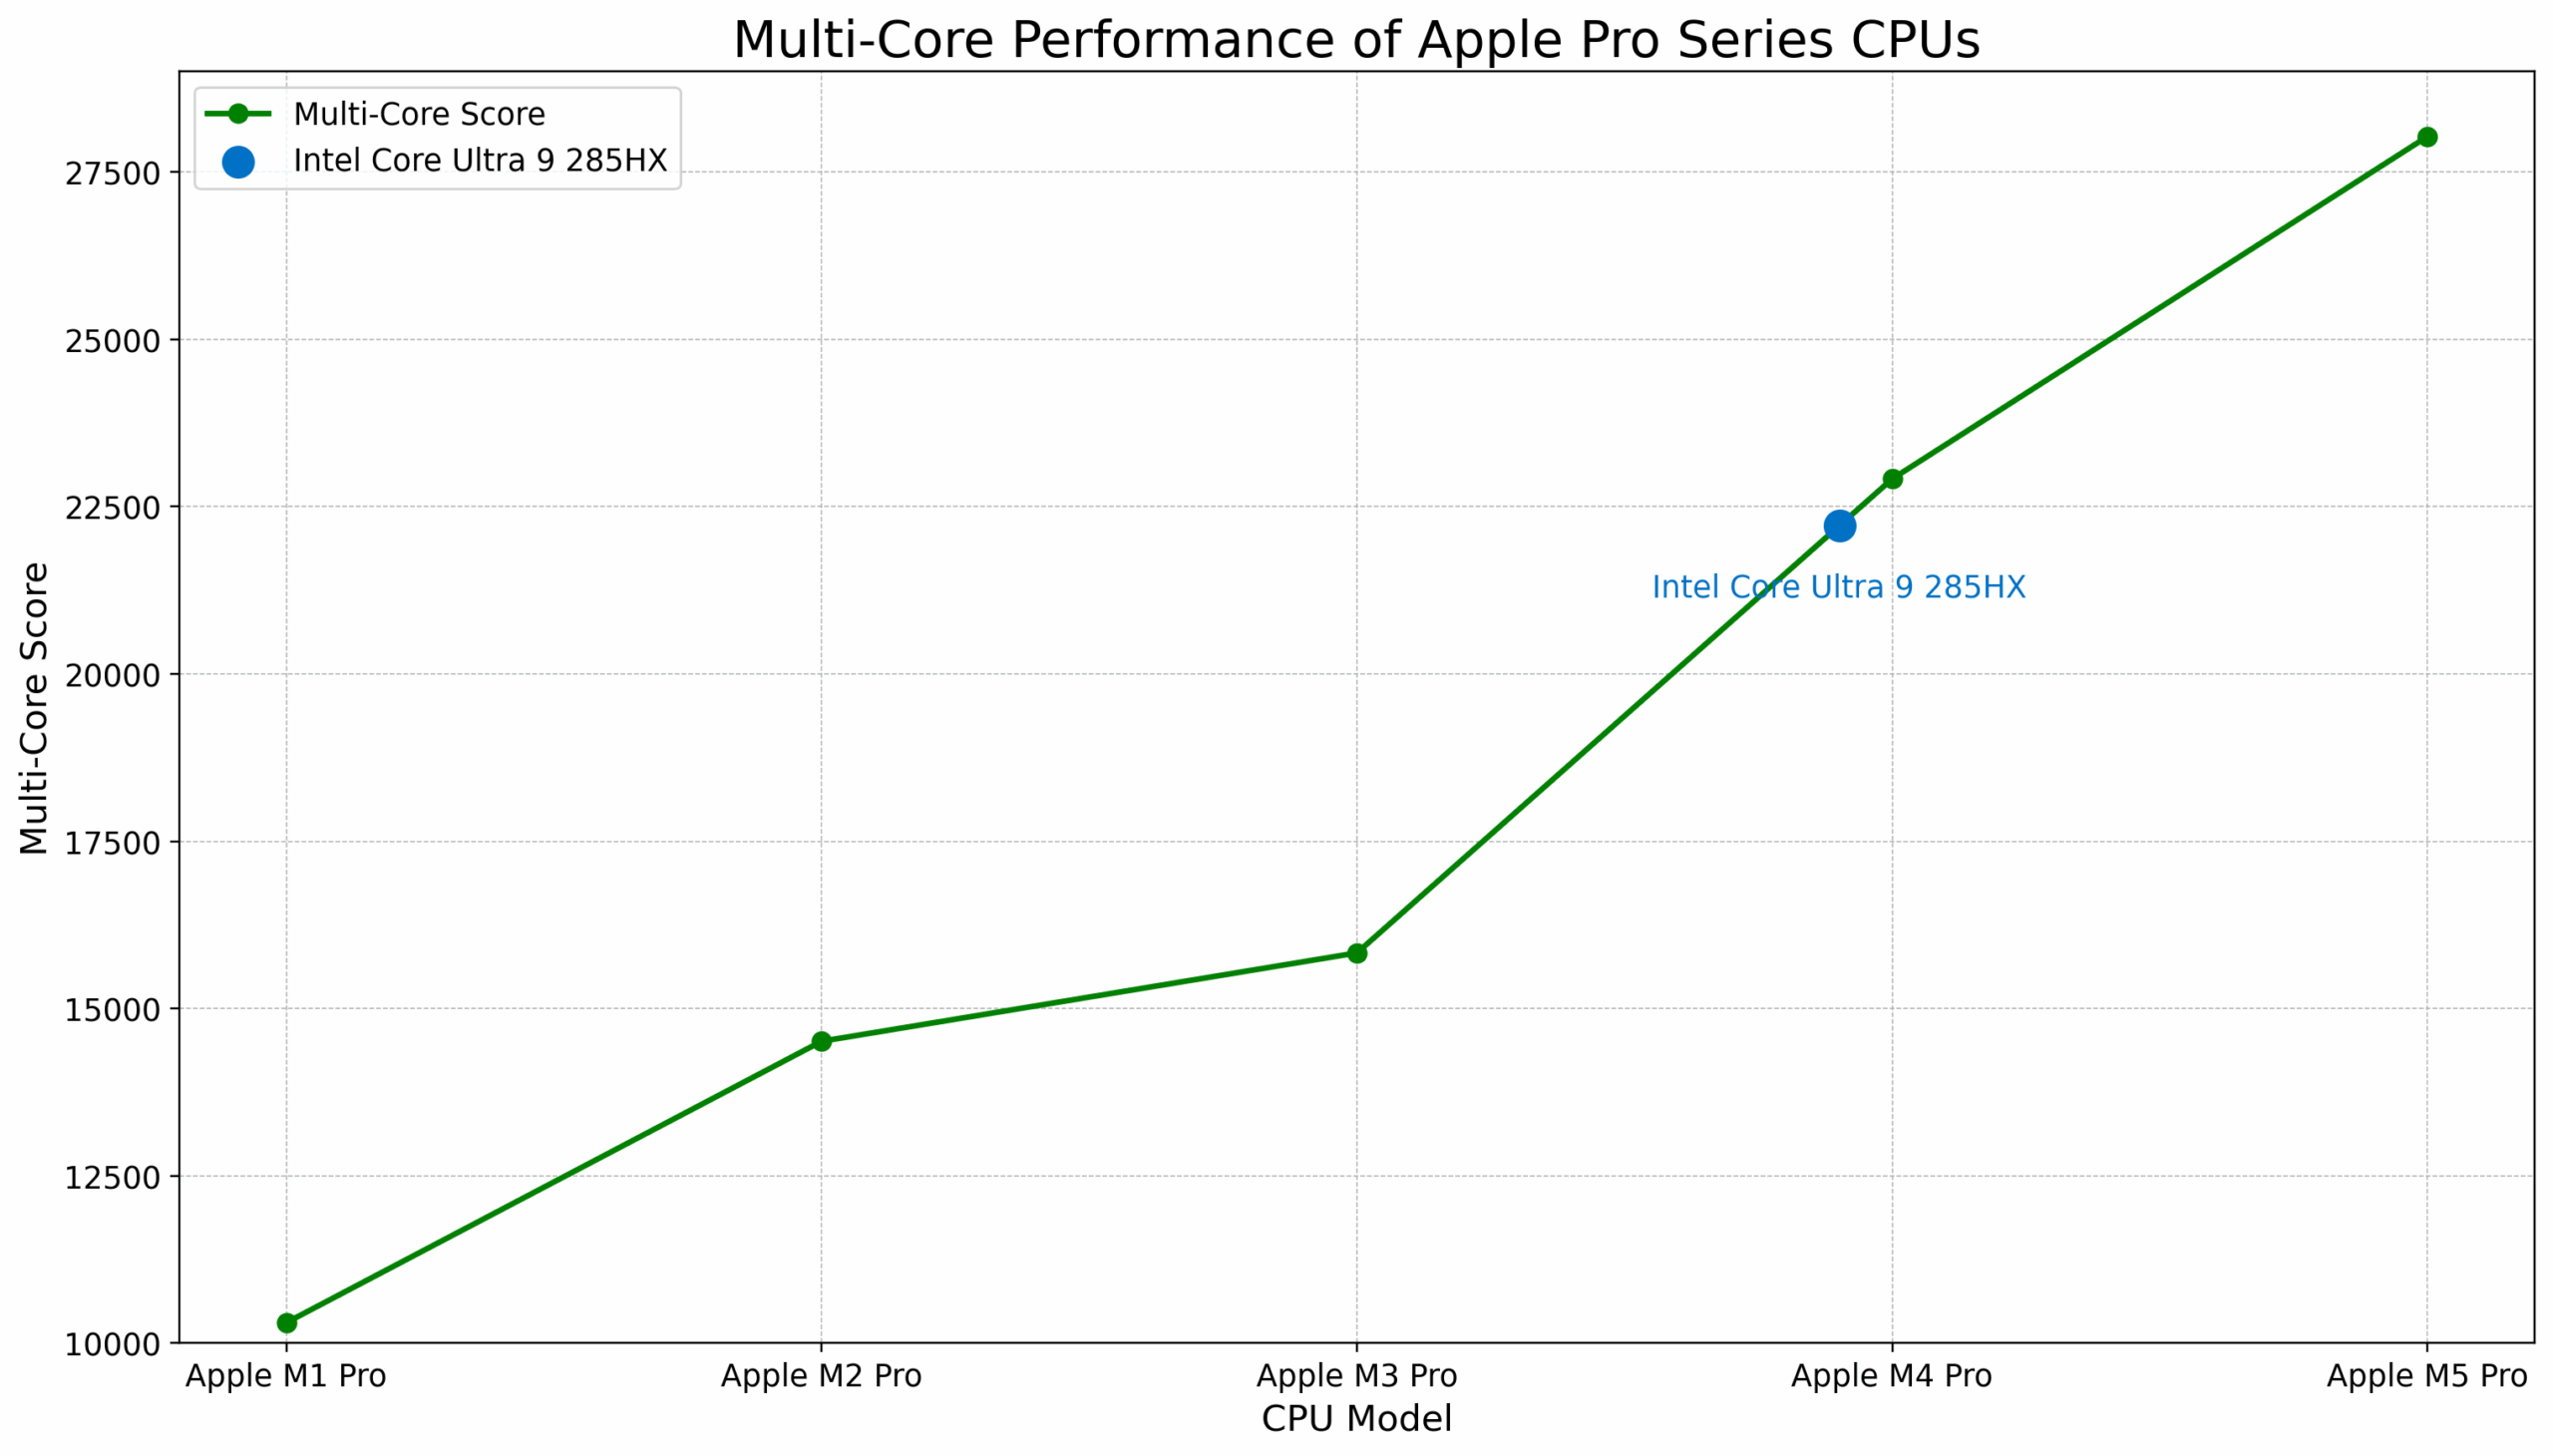
Apple M1 Pro vs M2 Pro vs M3 Pro vs M4 Pro vs M5 Pro
The 14-core M4 Pro has 10 performance cores that deliver a crazy performance jump of 45%! This is 3% higher than Intel’s mobile flagship Intel Core Ultra 9 285HX. So basically the Ultra 9 285HX is approximately as fast as the Apple M3 in single-core, and as the Apple M4 Pro in multi-core.
| CPU | Geekbench 6 Multi-Core | Performance Jump (%) |
| Apple M1 Pro (8-core CPU) | 10 307 | |
| Apple M2 Pro (12-core CPU) | 14 511 | +41% |
| Apple M3 Pro (12-core CPU) | 15 831 | +9% |
| Apple M4 Pro (14-core CPU) | 22 914 | +45% |
| Apple M5 Pro (18-core CPU) | 28030 | +22% |
| Average performance jump: 29% | ||
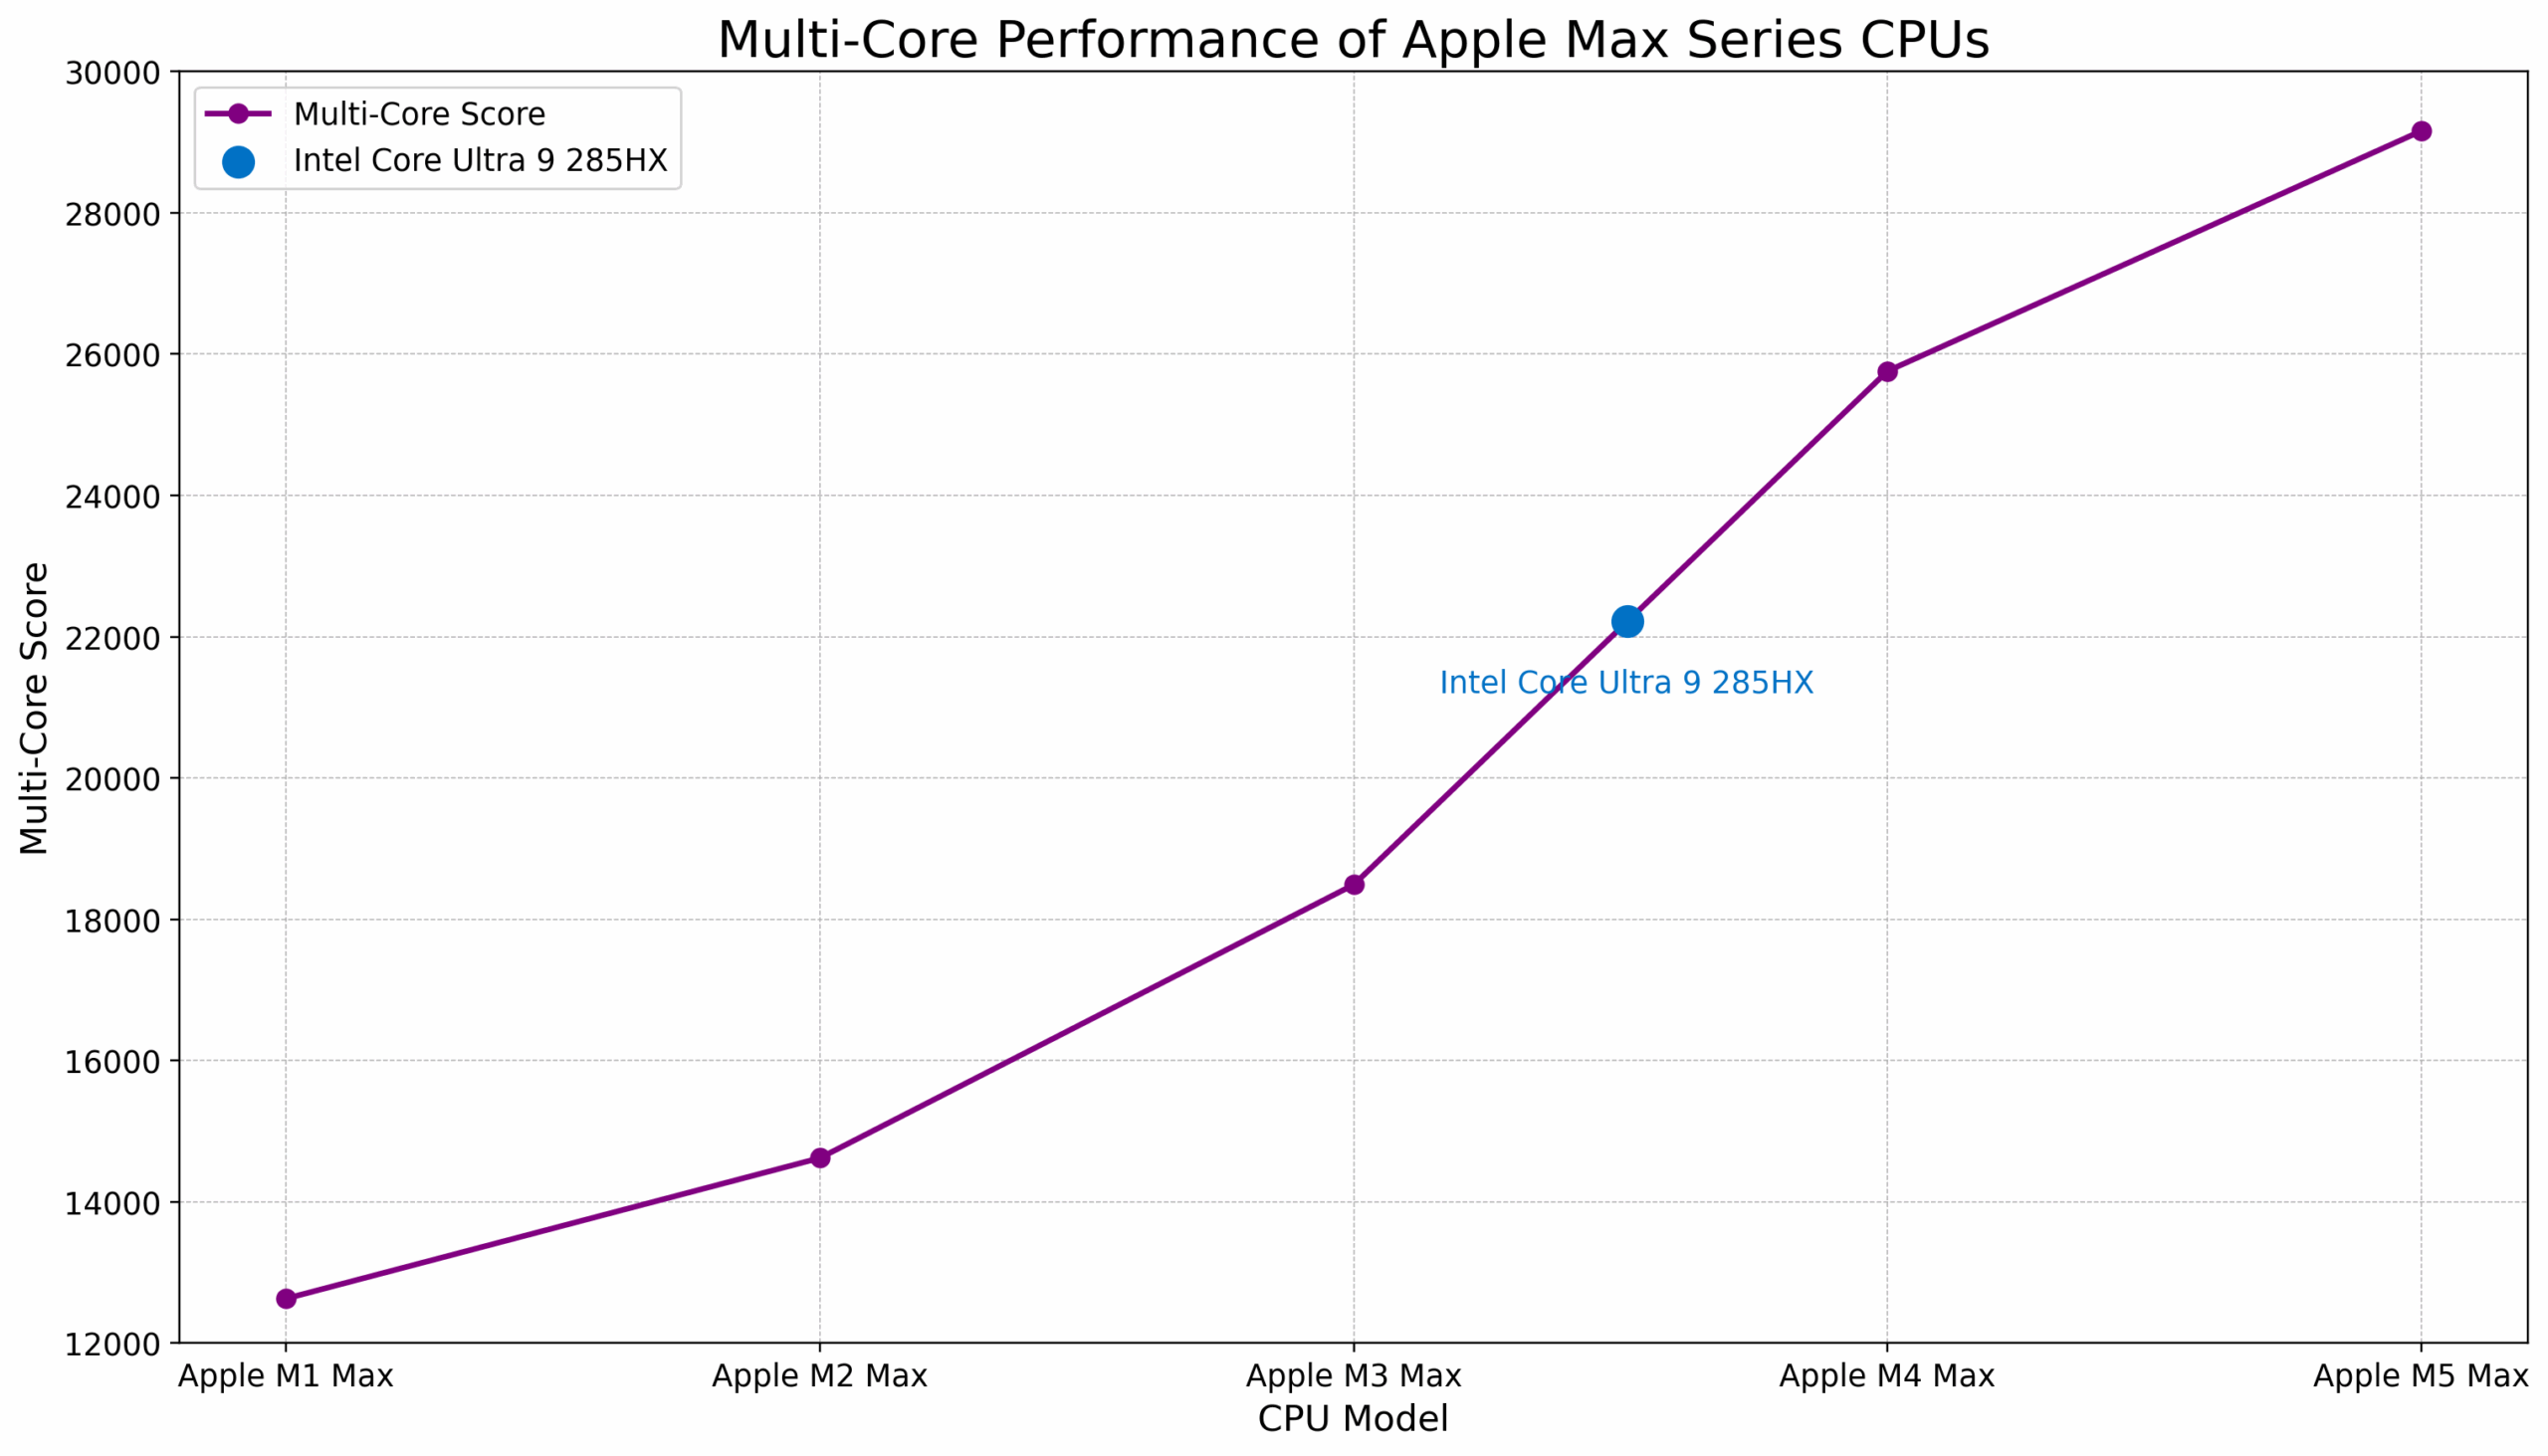
Apple M1 Max vs M2 Max vs M3 Max vs M4 Max vs M5 Max
M3 Max was the only Apple processor to outperform Intel’s then flagship i9-14900HX when comparing mobile processors. Now the blue flagship is Intel Core Ultra 9 285HX, and its multi-core result goes just between M3 Max and M4 Max.
M5 Max scores at 29 159 points, 31% above 285HX:
| CPU | Geekbench 6 Multi-Core | Performance Jump (%) |
| Apple M1 Max (10-core CPU) | 12 631 | |
| Apple M2 Max (12-core CPU) | 14 621 | +16% |
| Apple M3 Max (14-core CPU) | 18 490 | +26% |
| Apple M4 Max (16-core CPU) | 25 760 | +39% |
| Apple M5 Max (18-core CPU) | 29 159 | +13% |
| Average performance jump: 24% | ||
Apple M1 Ultra vs M2 Ultra vs M3 Ultra vs M4 Ultra and M5 Ultra (Projected)
Edit [03/2025]: Apple M3 Ultra was released much later than expected but it’s here, and it’s a huge update – 33% performance jump! This alters the projection for M4 Ultra from 33 773 pts to 37 867 pts, and the projection for M5 Ultra climbs to insane 42 864 pts!
Given that Ultra chips are typically used in desktop configurations, we’re swapping the mobile Intel Core Ultra 9 285HX with the desktop flagship Intel Core Ultra 9 285K which scores 22,000 points in the Multi-Core test and is 4% faster than the M2 Ultra.
As a result, M4 Ultra is expected to be 72% faster than Intel Core Ultra 9 285K and the M5 Ultra could be twice as fast as the Intel Core Ultra 9 285K. Of course, that’s just a projection, and Apple would probably need a redesign of the Mac Studio to be able to fit an M4 Ultra or M5 Ultra in it.
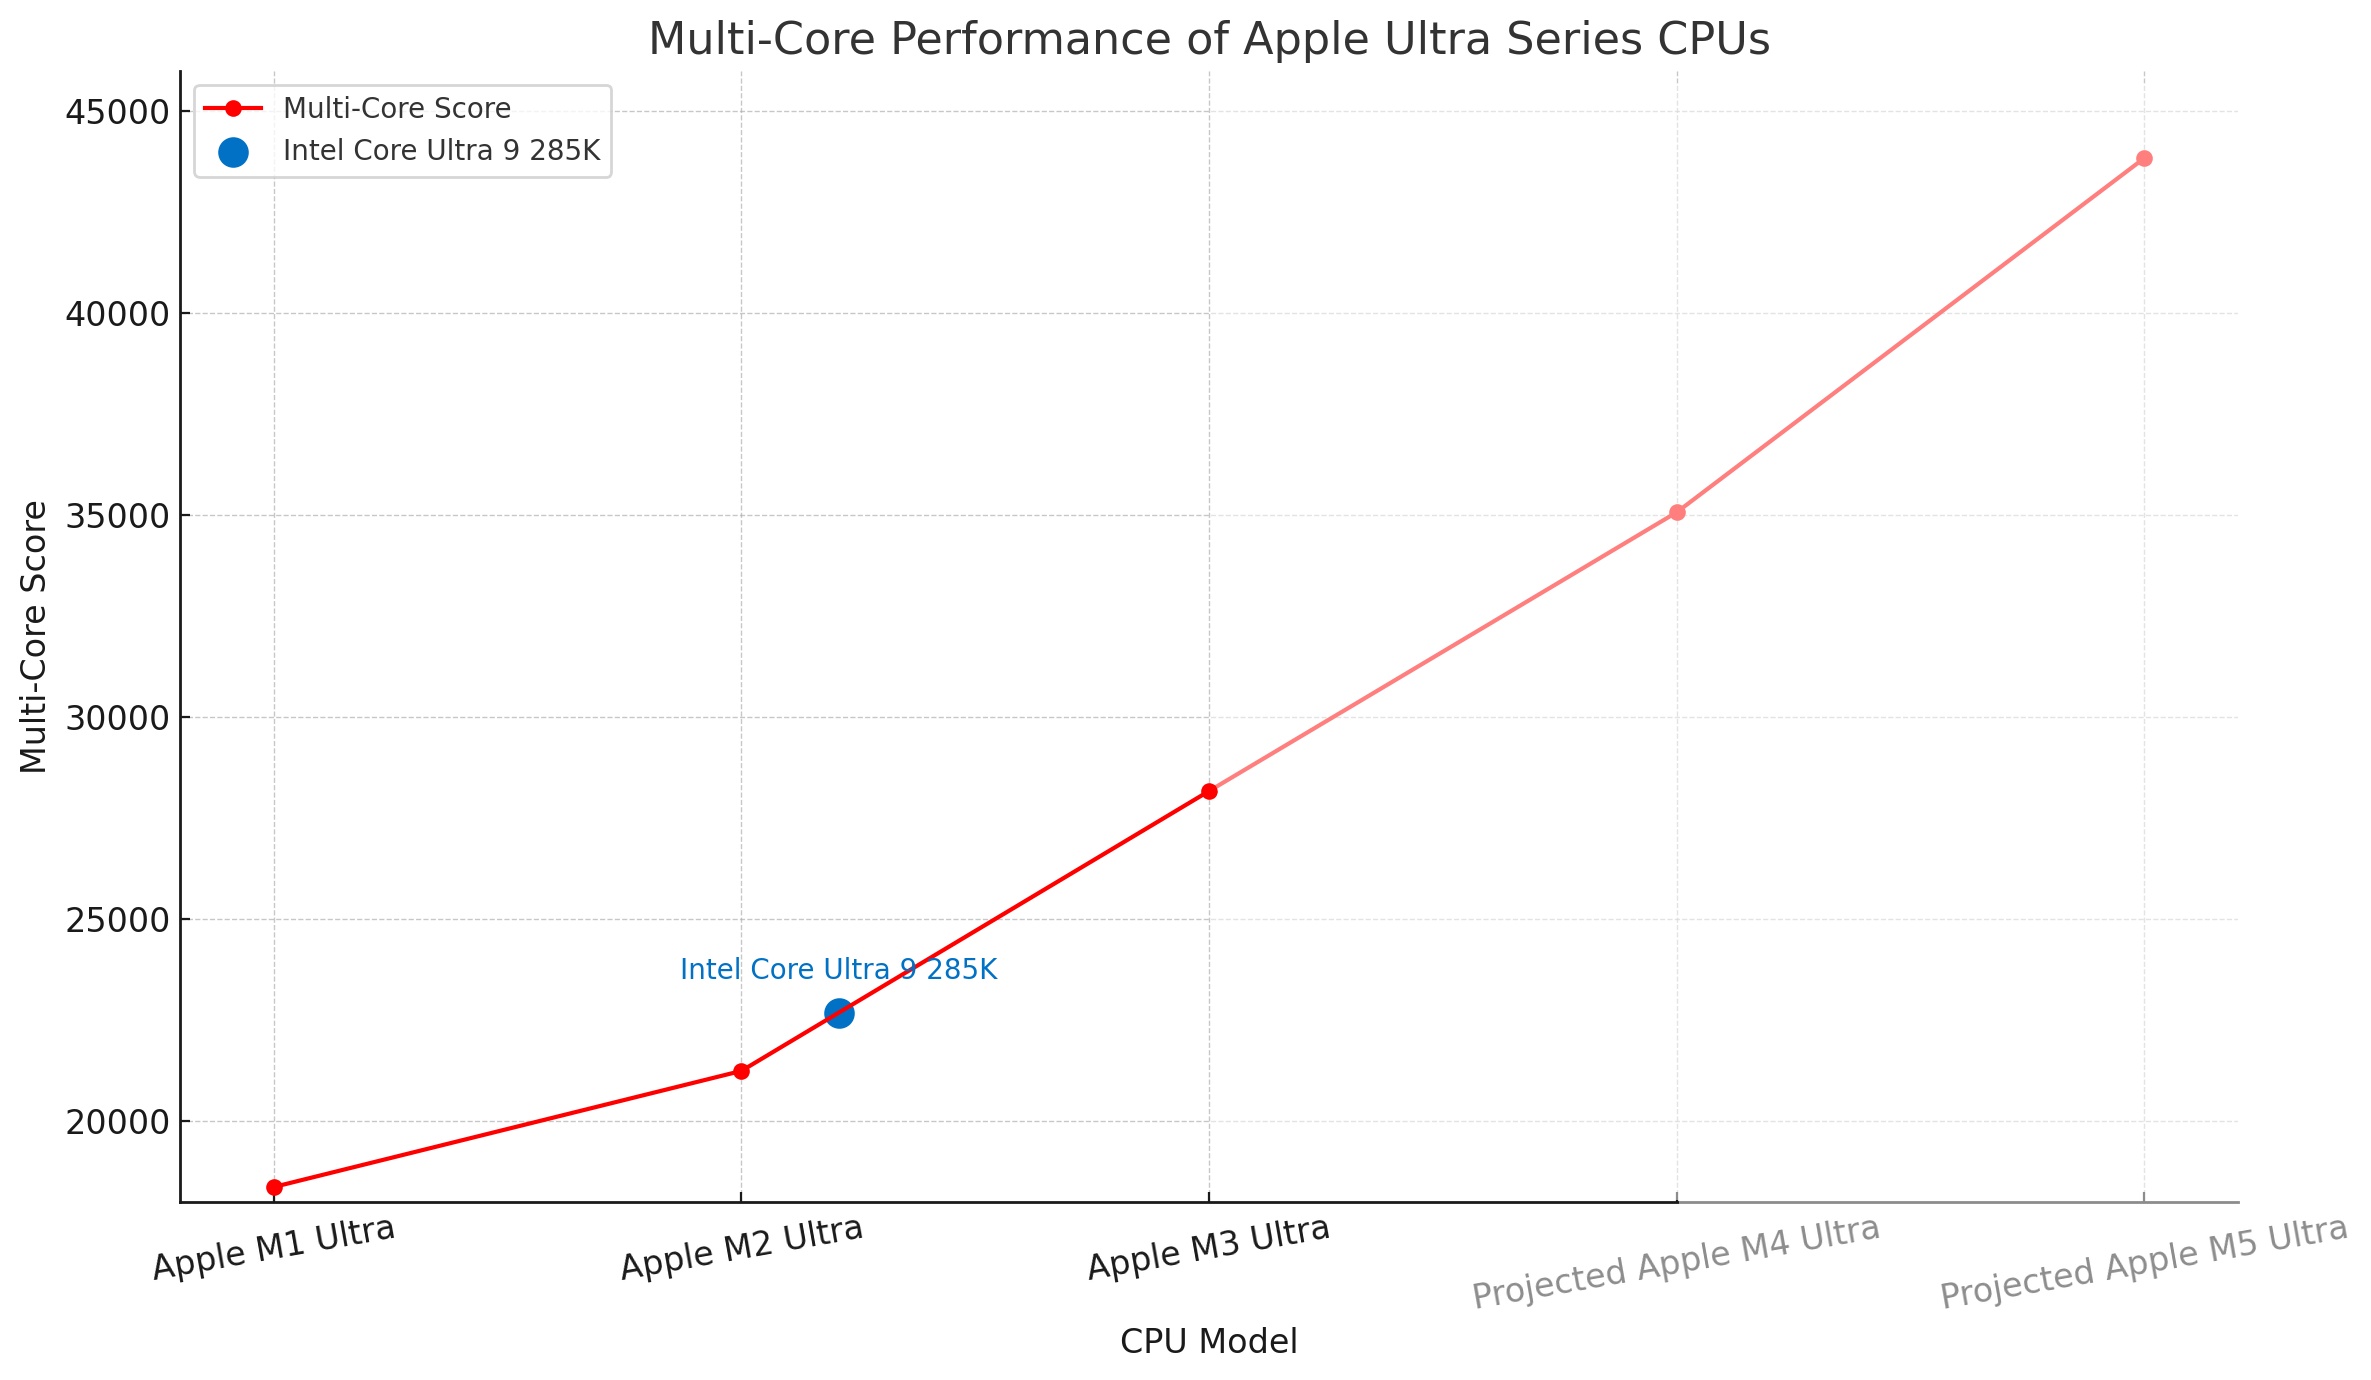
| CPU | Geekbench 6 Multi-Core | Performance Jump (%) |
| Apple M1 Ultra | 18 367 | |
| Apple M2 Ultra | 21 241 | +16% |
| Apple M3 Ultra | 28 169 | +33% |
| Projected Apple M4 Ultra | 37 867 | +34% |
| Projected Apple M5 Ultra | 42 864 | +13% |
| Average performance jump: 25% | ||
The Ultimate Comparison:
Now, let’s conduct a thorough comparison of all Apple M-series CPUs using actual data.
The latest Apple M5 processor is the fastest CPU in terms of single-core power:
When it comes to heavy work, the Apple M5 has multi-core peformance similar to the smaller variant of M3 Max (14-core) and it’s 14% below M4 Pro (12-core). However, the M4 Max variant boasts an extraordinary memory bandwidth (409.6 GB/s), which is 3-4x that of the M4 (120 GB/s) and 2x that of the M2 Pro (204.8 GB/s), proving beneficial for AI projects. The king for AI is the Apple M3 Ultra with 28,000+ multi-core score, and 819.3 GB/s memory bandwidth.
The M5 Pro variant matches the multi-core performance of M3 Ultra, and the M5 Max is even more powerful:
We’ve highlighted only the top-performing CPU variants above, where multiple versions of the same model exist. Here is the complete list of all M-series processors and their single and multi-core scores:
| CPU | Single-Core Score | Multi-Core Score |
|---|---|---|
| Apple M5 Max (18-core CPU) | 4305 | 29159 |
| Apple M5 Pro (18-core CPU) | 4276 | 28030 |
| Apple M5 Pro (15-core CPU) | TBD | TBD |
| Apple M5 (10-core) | 4227 | 17802 |
| Apple M5 (9-core) | 4103 | 15308 |
| Apple M4 Max (16-core) | 3880 | 25760 |
| Apple M4 Max (14-core) | 3961 | 22725 |
| Apple M4 Pro (14-core) | 3943 | 22914 |
| Apple M4 Pro (12-core) | 3922 | 20622 |
| Apple M4 (10-core) | 3830 | 14990 |
| Apple M4 (9-core) | 3671 | 13381 |
| Apple M4 (8-core) | 3650 | 13836 |
| Apple M3 Ultra (32-core CPU) | 3247 | 28169 |
| Apple M3 Ultra (28-core CPU) | 3244 | 27091 |
| Apple M3 Max (16-core CPU) | 3270 | 21385 |
| Apple M3 Max (14-core CPU) | 3109 | 18490 |
| Apple M3 Pro (12-core CPU) | 3202 | 15831 |
| Apple M3 Pro (11-core CPU) | 3067 | 14453 |
| Apple M3 (8-core CPU) | 3135 | 12042 |
| Apple M2 Ultra (24-core CPU) | 2691 | 21241 |
| Apple M2 Max (12-core CPU) | 2642 | 14621 |
| Apple M2 Pro (12-core CPU) | 2678 | 14511 |
| Apple M2 Pro (10-core CPU) | 2590 | 11455 |
| Apple M2 (8-core CPU) | 2613 | 10082 |
| Apple M1 Ultra (20-core CPU) | 2405 | 18367 |
| Apple M1 Max (10-core CPU) | 2397 | 12631 |
| Apple M1 Pro (8-core CPU) | 2351 | 10307 |
| Apple M1 (8-core CPU) | 2386 | 8571 |
We hope this summary helps you decide which M-series CPU to choose.
You may also find our other analysis interesting:
The Gap is Getting Scary: Apple Leaves Intel in the Dust
And of course, don’t miss our comparison with the new exciting arrival, the Qualcomm Snapdragon X Elite:
Apple M4 vs Snapdragon X Elite – The Next-Gen CPU Battle


![[June 2026] Best-Selling Laptop Brands on Amazon Global – Apple’s Unrivaled Dominance in Units and Revenue](https://laptopmedia.com/wp-content/uploads/2026/07/GLOBAL-Best-Brands-400x225.jpg)
![[June 2026] Amazon Global: Top 10 Best-Selling Laptops – Apple’s New MacBook Neo Storms to #1, Reshaping the Market with Affordability](https://laptopmedia.com/wp-content/uploads/2026/07/Best-Selling-Laptops-GLOBAL-Top-10-400x225.jpg)
![[June 2026] Amazon Global: Top 10 Best-Selling Gaming Laptops – Acer’s Nitro V 16S AI Dominates Sales, While ASUS Leads Overall Revenue](https://laptopmedia.com/wp-content/uploads/2026/07/Best-Selling-Gaming-Laptops-GLOBAL-Top-10-400x225.jpg)
![[June 2026] Global Ranking of Best-Selling Laptop GPUs on Amazon – NVIDIA RTX 5060 is the Top-Selling Dedicated GPU](https://laptopmedia.com/wp-content/uploads/2026/07/Best-Selling-GPUs-GLOBAL-Top-10-400x225.jpg)
![[June 2026] Global Ranking of Best-Selling Laptop CPUs on Amazon – Apple M5 Dominates, AMD Ryzen 7 260 Gets Solid Premium Share](https://laptopmedia.com/wp-content/uploads/2026/07/Best-Selling-CPUs-GLOBAL-Top-10-400x225.jpg)

这个文章总结的太棒了,什么神仙编辑,把我想要的信息都罗列出来了
这条评论真是太温暖了,让我非常开心!谢谢你,Yesir!
—
That was the most heartwarming comment; it made my day! Thank you, Yesir!
Best Apple M chips analysis
Thank you very much, wu wei!
赞 赞 赞 加鸡腿
🙂 👍
incredible comparison design. any chance for gpu/npu?
Good idea!
Great article, would love to see update with GPU performance gain comparsion too
Perfect analysis. There are all I want to get!
Hello, I don’t get the comparison with i9-14900K .. it’s just purposely written and depicted to make apple chips better … In reality i9 cpu that was used as a reference point is on the top of the list
Check this out, bro, https://versus.com/en/intel-core-i9-14900hx-vs-intel-core-i9-14900k
I had a look at your chart which does not include the M5 and the graphs above are accurate.
The i9-14900K only beats the lower spec Apple chips at multi core performance and Cinebench. It trails everywhere else.
You seem to be going off the Crossmark Overall score which is distorted by the large number of No Value results for the Apple chips because some of the tests do not run on the Macs.
Great effort for putting together such an extensive comparison. I only wish the Y-axis started at zero because at the moment, you’ve artificially amplified the true relative difference between all of them.
Thank you, WFR! While a zero-start axis is indeed the safest choice for showing absolute performance, my goal here was slightly different. I wanted to highlight the relative uplift between generations, using the M1 (2020) as a baseline, so readers can quickly judge “how big is the jump from what I have to what I’m considering” (with the added context of Intel CPUs as well). I initially tried charts starting at zero, but the bars became compressed and the differences between closer generations were much harder to read at a glance. For example, if you’re on M4 and mostly care… Read more »
You do not show the relative uplift if you chop off the lower part of the graph.
For relative values you HAVE to show the whole enchalada, not the clipped M4 minus M1 which make the M1 zero value.
The % uplift you show in the figures actually works off the WHOLE value not a clipped value.
It would be great to have all M series Apple silicon GPU benchmarks.
每次都看这个总结,各种对比数据太清晰了,期待m5pro和max的加入,感谢你的付出
Thank you! The new models are coming to our lab, stay tuned for full analysis and reviews!
—-
谢谢!新模型即将送达我们的实验室,敬请期待完整的分析和评测!
Amazing! I was just about to do a spreadsheet on exactly this and found this site immediately. Thanks for the great work. 😃👏 All that’s missing is a “Bangs for Bucks chart” with the performance rated against price for each model. Just one suggestion. The Charts are too big for the information. If they were smaller you could take in all the information withouy scrolling. You should always start charts them from zero clipping them does not show the correct relativity. For the pricing I’d tilt the charts to axonometric view with $ as the height off the chart. We… Read more »
It would be even better if there were a graphics performance rating.