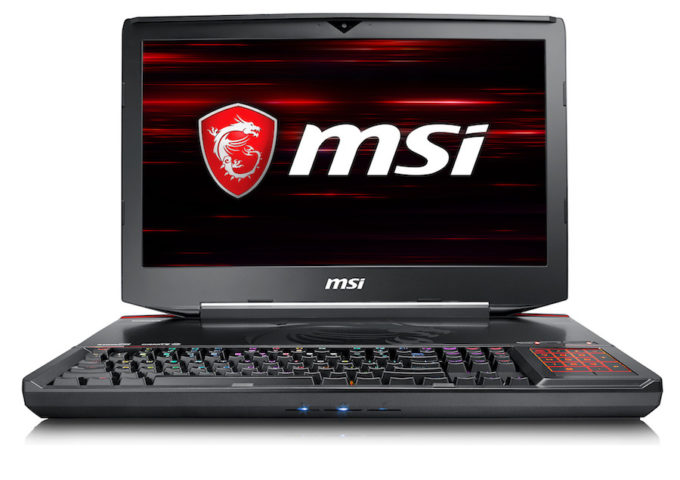
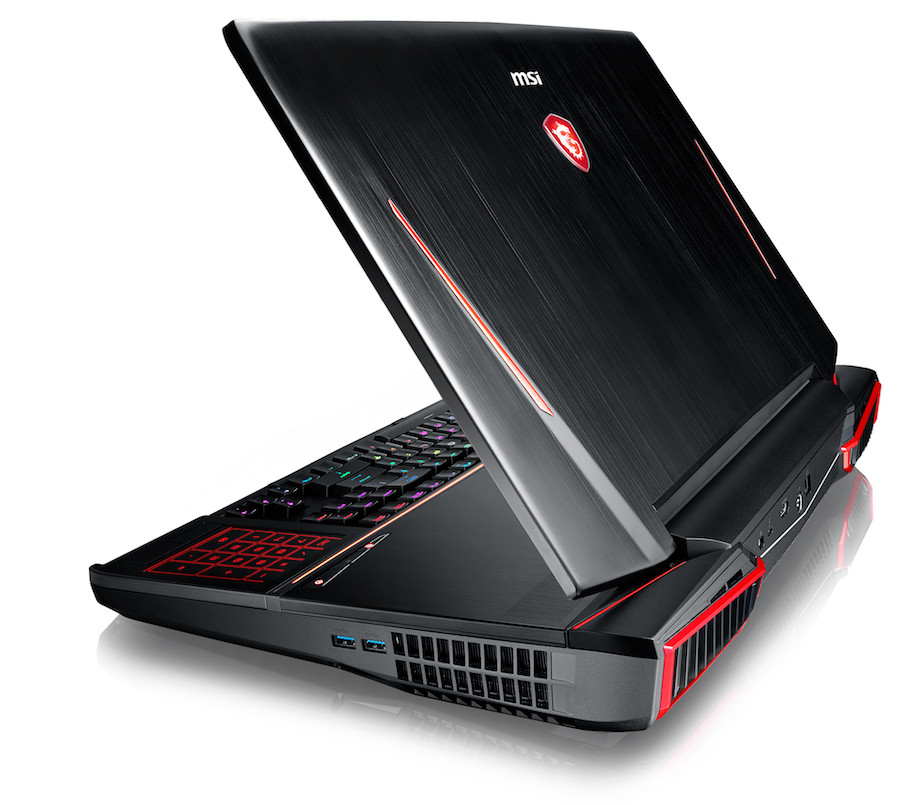
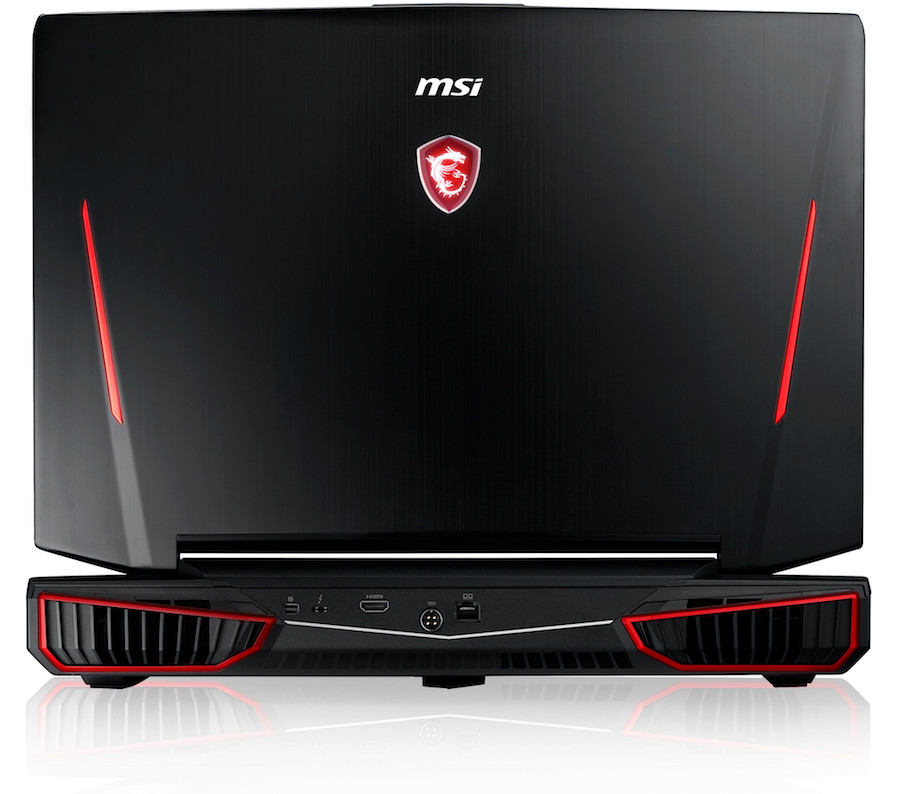
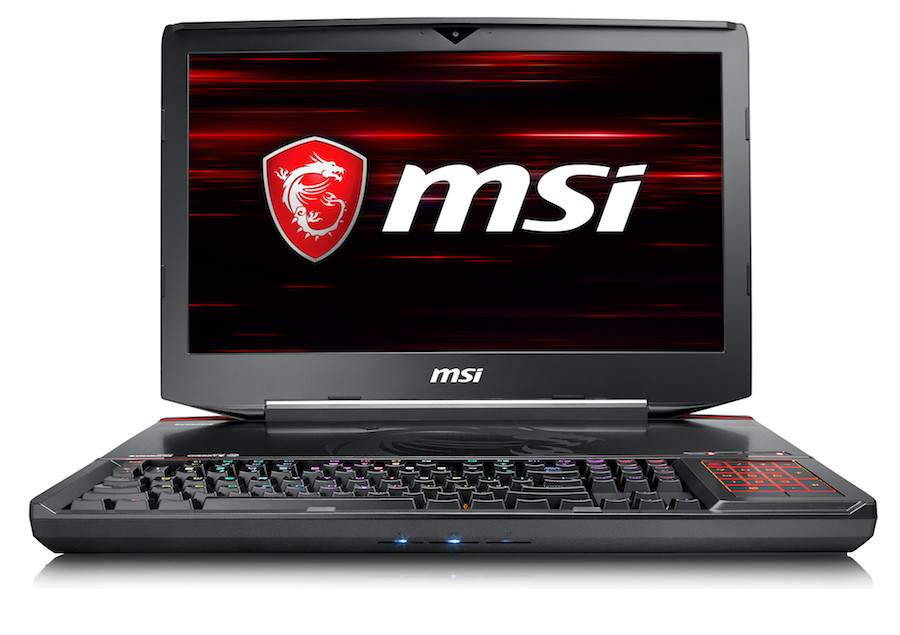
MSI GT83 Titan 8R

- Date Published: 19 May 2018
- Intel Core i7-8850H
- 2x NVIDIA GeForce GTX 1080 (8GB GDDR5X, SLI)
- 18.4”, Full HD (1920 x 1080), IPS
- 1000GB SSD + 1000GB HDD
- 32GB DDR4, 2666 MHz
- 5.50 kg (12.1 lbs)
![[June 2026] Best-Selling Laptop Brands on Amazon Global – Apple’s Unrivaled Dominance in Units and Revenue](https://laptopmedia.com/wp-content/uploads/2026/07/GLOBAL-Best-Brands-400x225.jpg)
[June 2026] Best-Selling Laptop Brands on Amazon Global – Apple’s Unrivaled Dominance in Units and Revenue
Jul 06, 2026![[June 2026] Amazon Global: Top 10 Best-Selling Laptops – Apple’s New MacBook Neo Storms to #1, Reshaping the Market with Affordability](https://laptopmedia.com/wp-content/uploads/2026/07/Best-Selling-Laptops-GLOBAL-Top-10-400x225.jpg)
[June 2026] Amazon Global: Top 10 Best-Selling Laptops – Apple’s New MacBook Neo Storms to #1, Reshaping the Market with Affordability
Jul 06, 2026![[June 2026] Amazon Global: Top 10 Best-Selling Gaming Laptops – Acer’s Nitro V 16S AI Dominates Sales, While ASUS Leads Overall Revenue](https://laptopmedia.com/wp-content/uploads/2026/07/Best-Selling-Gaming-Laptops-GLOBAL-Top-10-400x225.jpg)
[June 2026] Amazon Global: Top 10 Best-Selling Gaming Laptops – Acer’s Nitro V 16S AI Dominates Sales, While ASUS Leads Overall Revenue
Jul 06, 2026![[June 2026] Global Ranking of Best-Selling Laptop GPUs on Amazon – NVIDIA RTX 5060 is the Top-Selling Dedicated GPU](https://laptopmedia.com/wp-content/uploads/2026/07/Best-Selling-GPUs-GLOBAL-Top-10-400x225.jpg)
[June 2026] Global Ranking of Best-Selling Laptop GPUs on Amazon – NVIDIA RTX 5060 is the Top-Selling Dedicated GPU
Jul 05, 2026![[June 2026] Global Ranking of Best-Selling Laptop CPUs on Amazon – Apple M5 Dominates, AMD Ryzen 7 260 Gets Solid Premium Share](https://laptopmedia.com/wp-content/uploads/2026/07/Best-Selling-CPUs-GLOBAL-Top-10-400x225.jpg)
[June 2026] Global Ranking of Best-Selling Laptop CPUs on Amazon – Apple M5 Dominates, AMD Ryzen 7 260 Gets Solid Premium Share
Jul 05, 2026
Lenovo Yoga 9i 2-in-1 Aura Edition (14″, Gen 11) review – 2.8K OLED, Great Speakers, and 15+ Hours of Battery
Jul 08, 2026Dell Pro Max 14 (MC14250) review – Powerful, Repairable, and Very Configuration-Dependent
Jul 04, 2026Lenovo Legion 5i (15″, Gen 11) review – Full-Power RTX 5060, OLED Display, and Real Upgradeability
Jun 30, 2026Lenovo LOQ 15 (15IPH11) review – The Coolest Budget Gaming Laptop of 2026?
Jun 27, 2026Acer Predator Helios 18 AI (PH18-I71) review – Stunning Mini LED, Brutal RTX 5090 Performance, Hot CPU
Jun 23, 2026