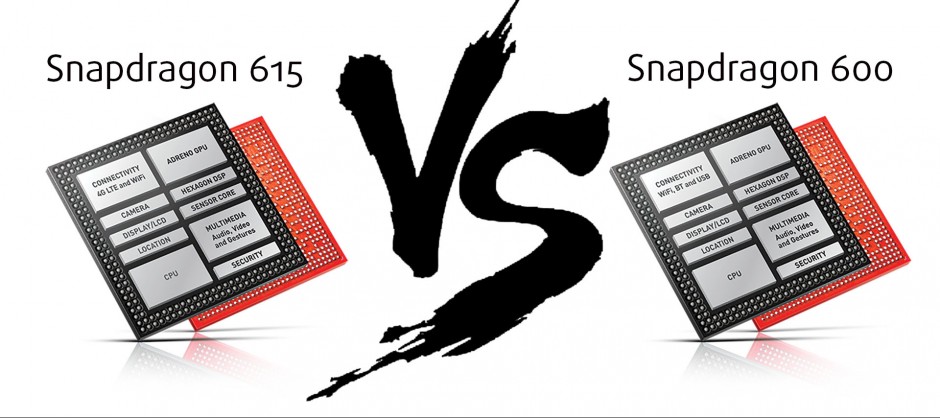
Qualcomm Snapdragon 615 (+ Adreno 405) vs Snapdragon 600 (+ Adreno 320) – specs, performance and benchmark results
We are currently testing Lenovo Vibe Shot, so we decided to compare the SoC of the device to its predecessor and see how they stack up in terms of performance. As soon as we complete all of our tests, we will publish our detailed review where you can find very interesting information, comparisons and test results.

| Qualcomm | Snapdragon 615 |
|---|---|
| Process | 28 nm |
| Cores | 4+4 |
| Frequency | 4 х 1.0GHz + 4 x 1.7GHz |
| Architecture | Cortex-A53 / 64-bit capability |
| GPU | Adreno 405 / 550 MHz |
| Qualcomm | Snapdragon 600 |
|---|---|
| Process | 28 nm |
| Cores | 4 |
| Frequency | 1.9 GHz |
| Architecture | Krait-300 |
| GPU | Adreno 320 |
The Snapdragon 615 (MSM8939) used in Lenovo Vibe Shot is a SoC mainly targeted at mid-range Android smartphones and tablets. It has eight Cortex-A53 cores grouped into two quad-core clusters. One of the clusters has a maximum clock rate of 1.0 GHz and is used in the not so demanding tasks in order to reduce energy consummation, while the other can be clocked at up to 1.7GHz, with the main purpose of handling the heavier, more demanding apps, lag free.
The Adreno 405 GPU, 64-bit capability and a couple of other improvements lead to this model’s higher performance per clock.
Even though Snapdragon 600 is an old model, announced in the beginning of 2013, it was a high-end SoC and is still somewhat relevant. The chip consists of four ARMv7 compatible Krait-300 cores with a clock capacity at 1.7 GHz, the manufacturing technology is 28 nm. The SoC is only capable of 32-bit computing. The performance of the cores is slightly worse than that of Cortex-A15, but energy efficiency is better. The GPU is an integrated Adreno 320.
Snapdragon 615’s CPU performance is much higher than that of Snapdragon 600, but in the graphics department, not only does the S615 not surpass the older S600, but even falls slightly behind.
| Benchmarks | Qualcomm Snapdragon 615 | Qualcomm Snapdragon 600 |
|---|---|---|
| Geekbench 3 (Multi-Core) | 2357 (+26%) | 1876 |
| Vellamo 2 Metal | 853 (+28%) | 668 |
| GFXBench 2.7 T-Rex (offscreen) | 15 (-12%) | 17 |


