Lenovo ThinkCentre Neo 50q Gen 4 Review: A Quiet, Upgradable Mini PC In The Palm Of Your Hand
Design, Performance
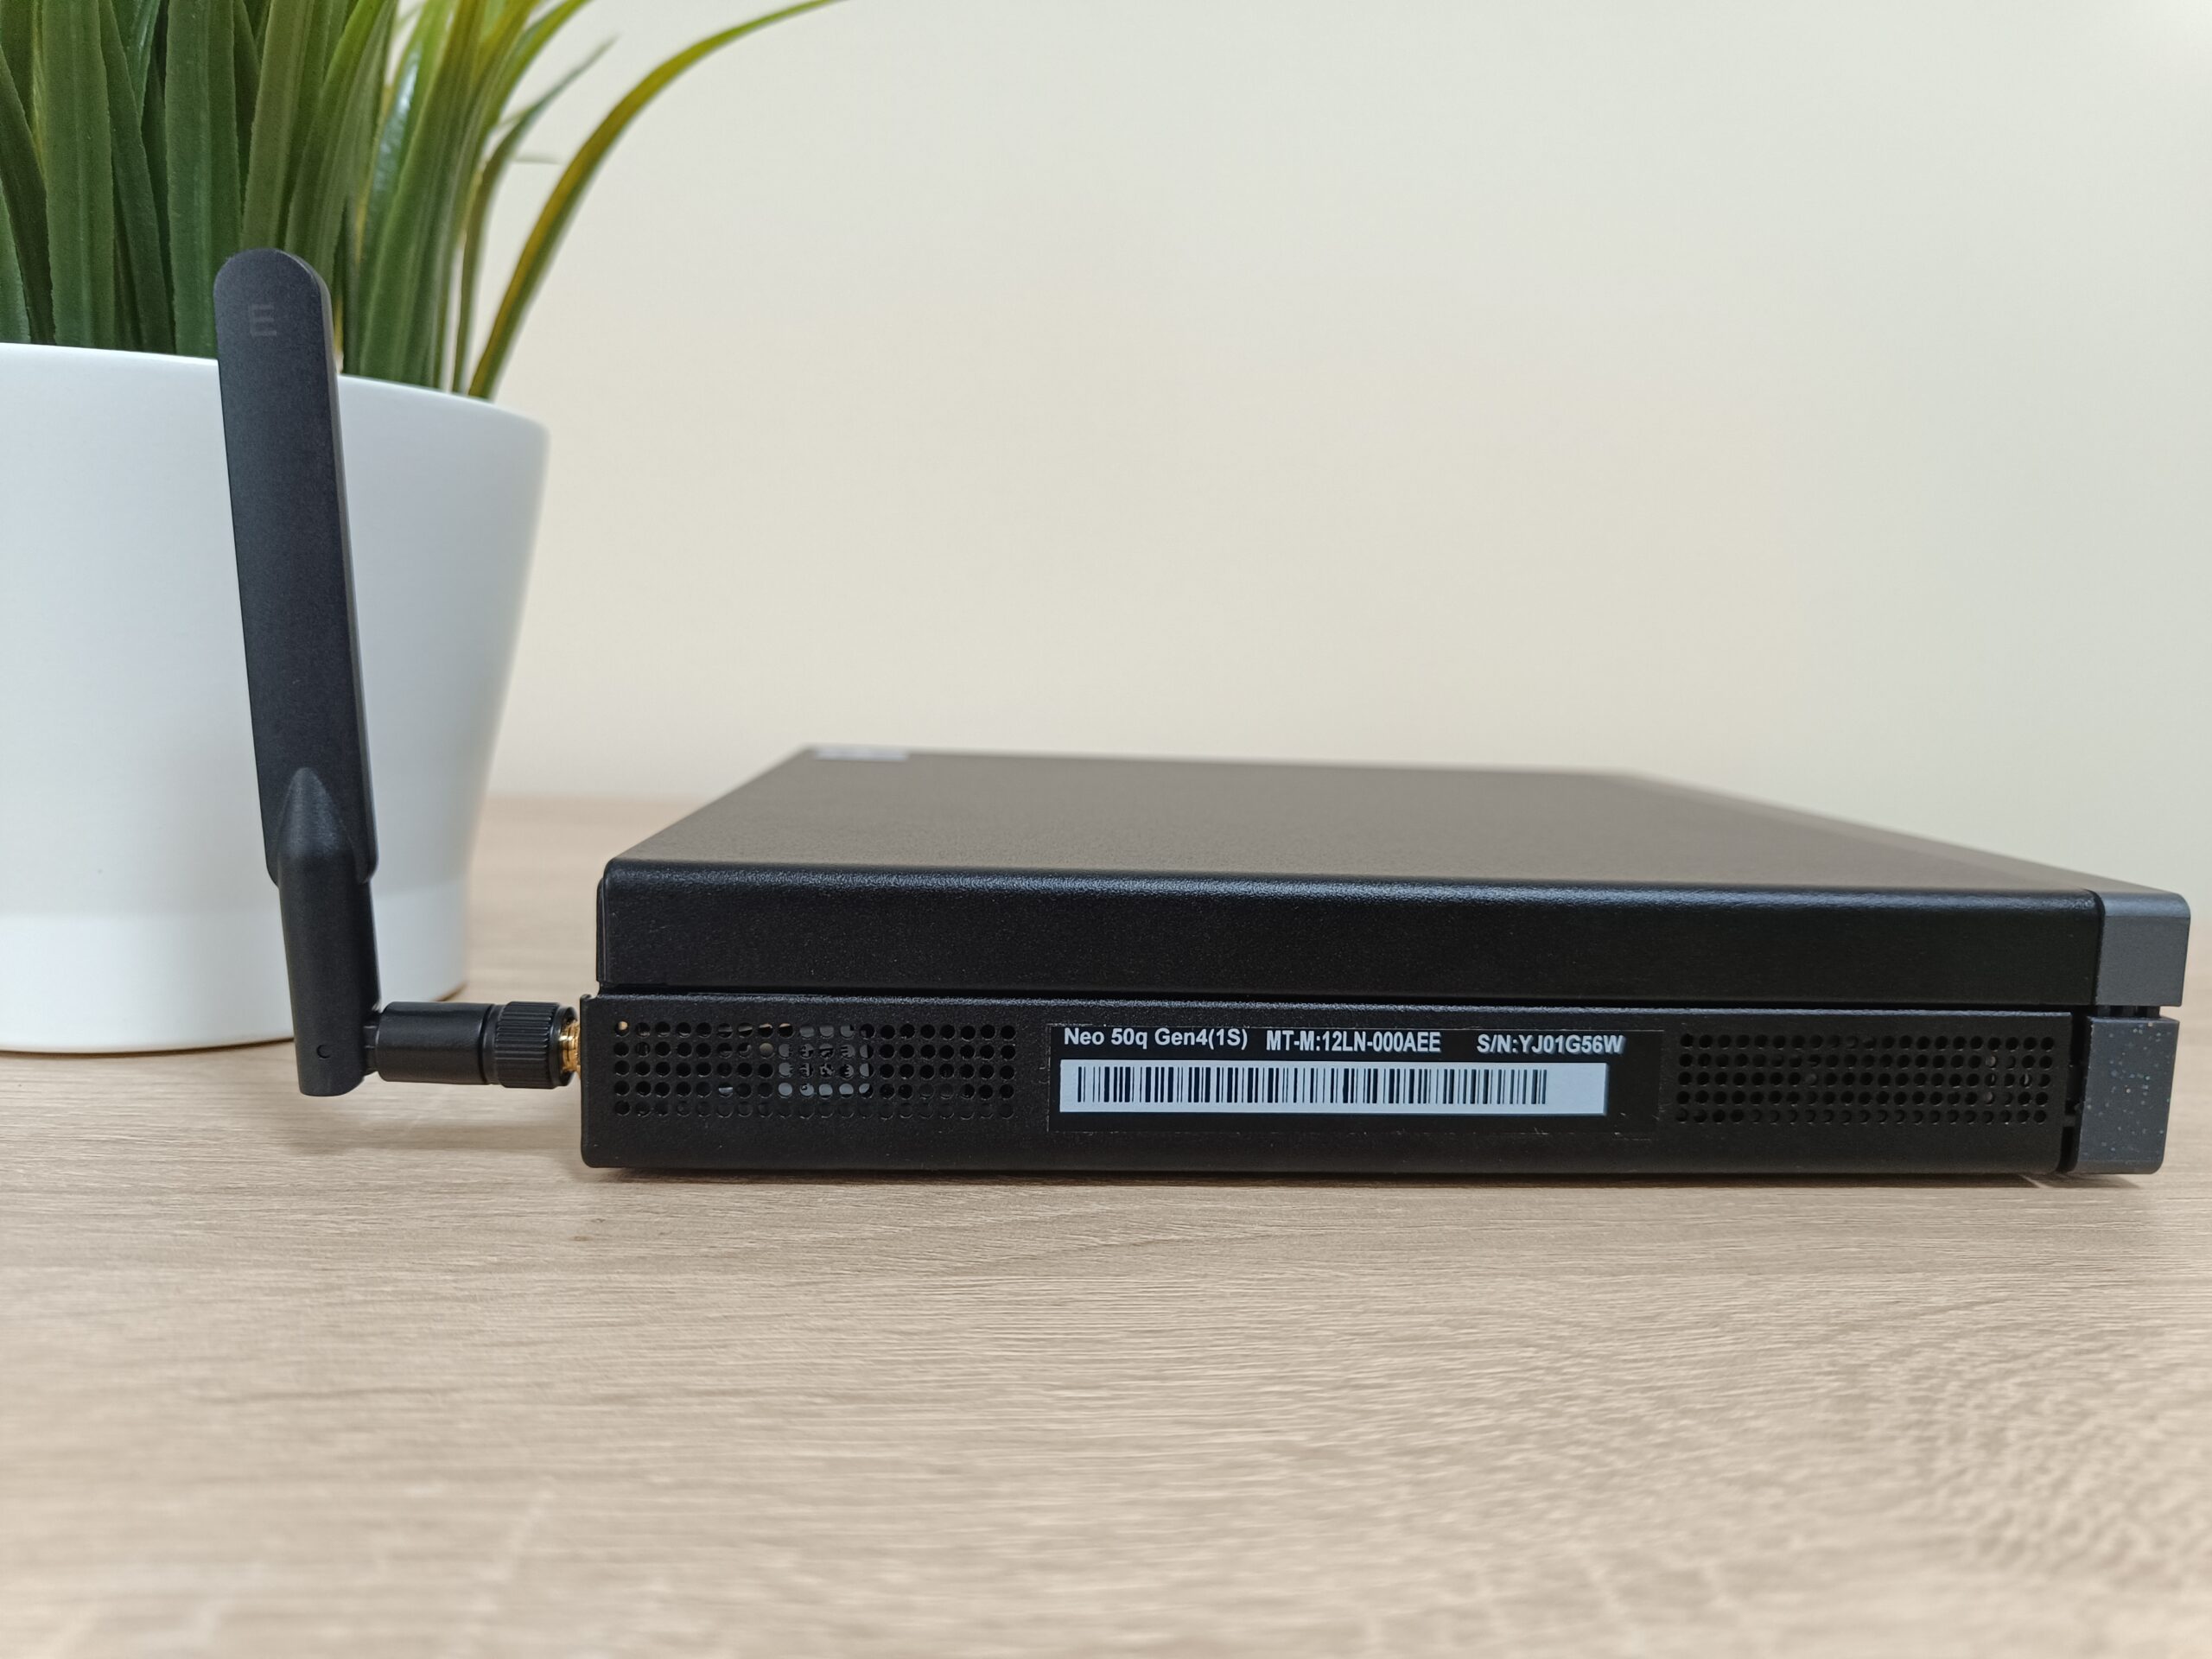
The ThinkCentre Neo 50q Gen 4 has a full-metal chassis, with just the front panel having some plastic. There’s an excess of Lenovo and ThinkCentre logos, including a Red LED on the I that lights up when the PC is on. The front is decorated with some speckles of green, yellow, and blue, which liven up what many would call the boring, industrial ThinkPad look. There are four cooling vents with two on each side, as well as an exhaust vent on the back (you’ll see the actual cooling a bit further down). In terms of weight and dimensions, the ThinkCentre weighs just 2.45 lbs, which is super low for a PC, while the dimensions make it look like a 7 by 7-inch square that’s just 1.44 inches thick.

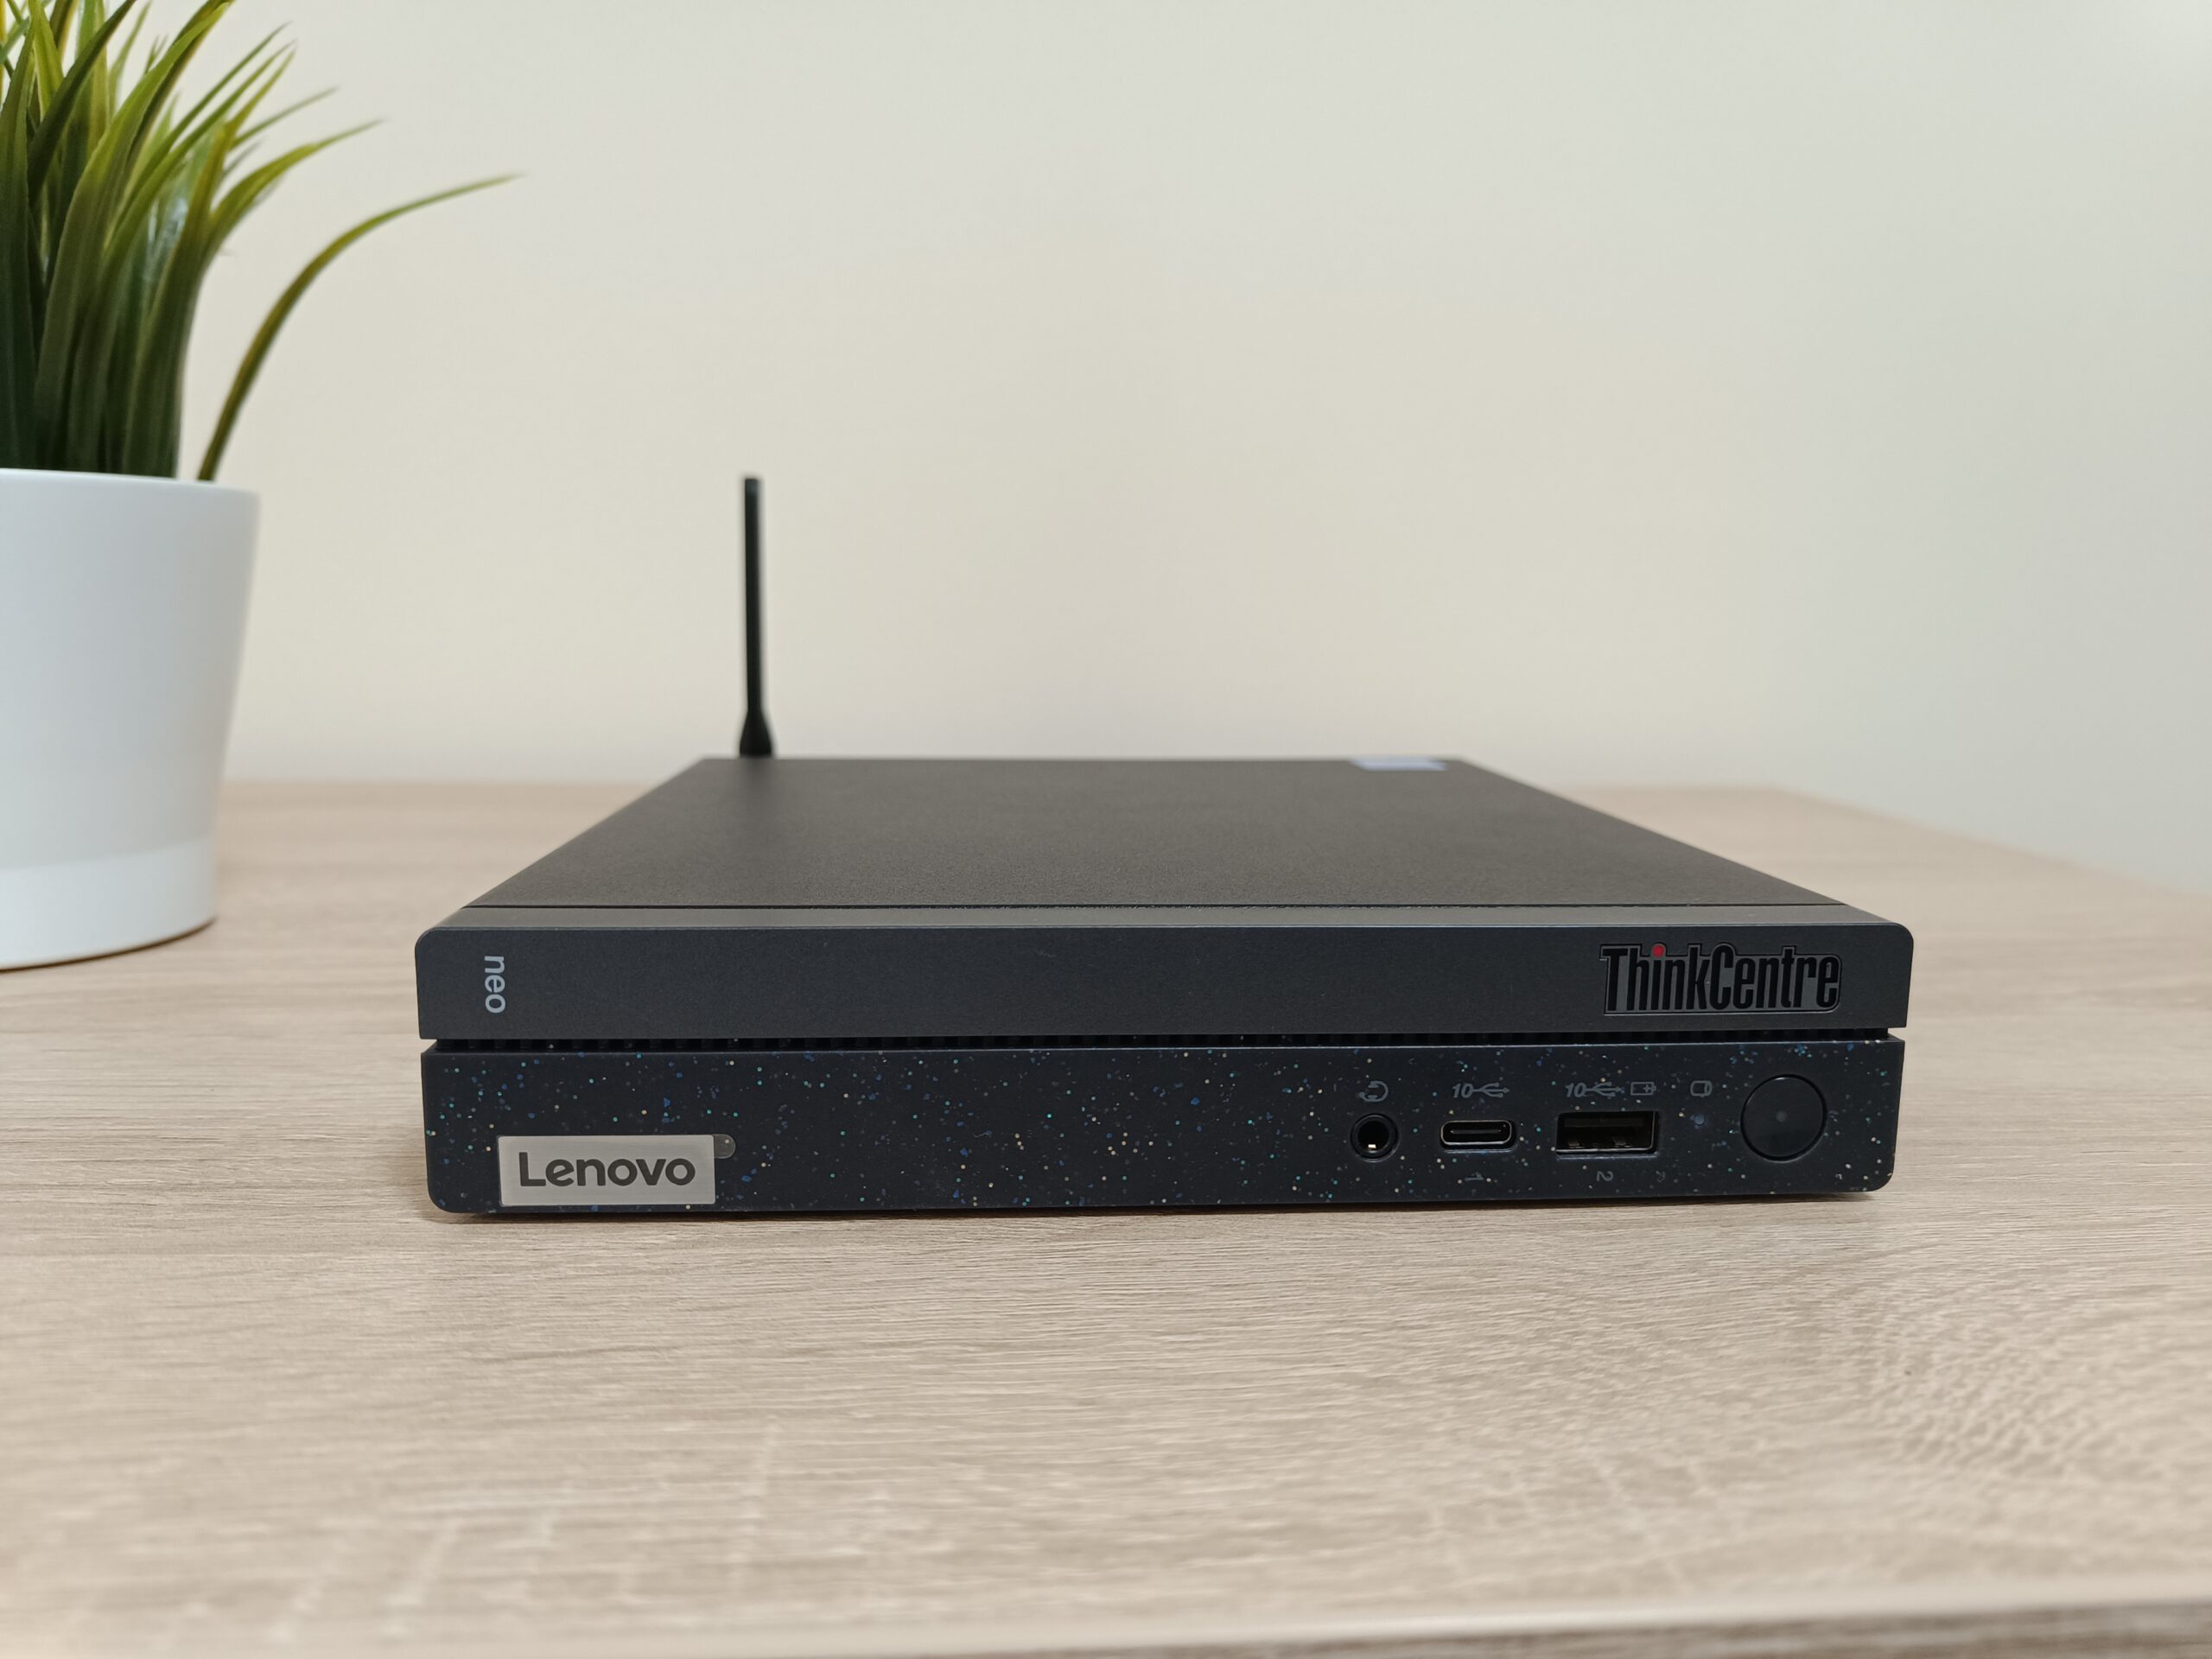
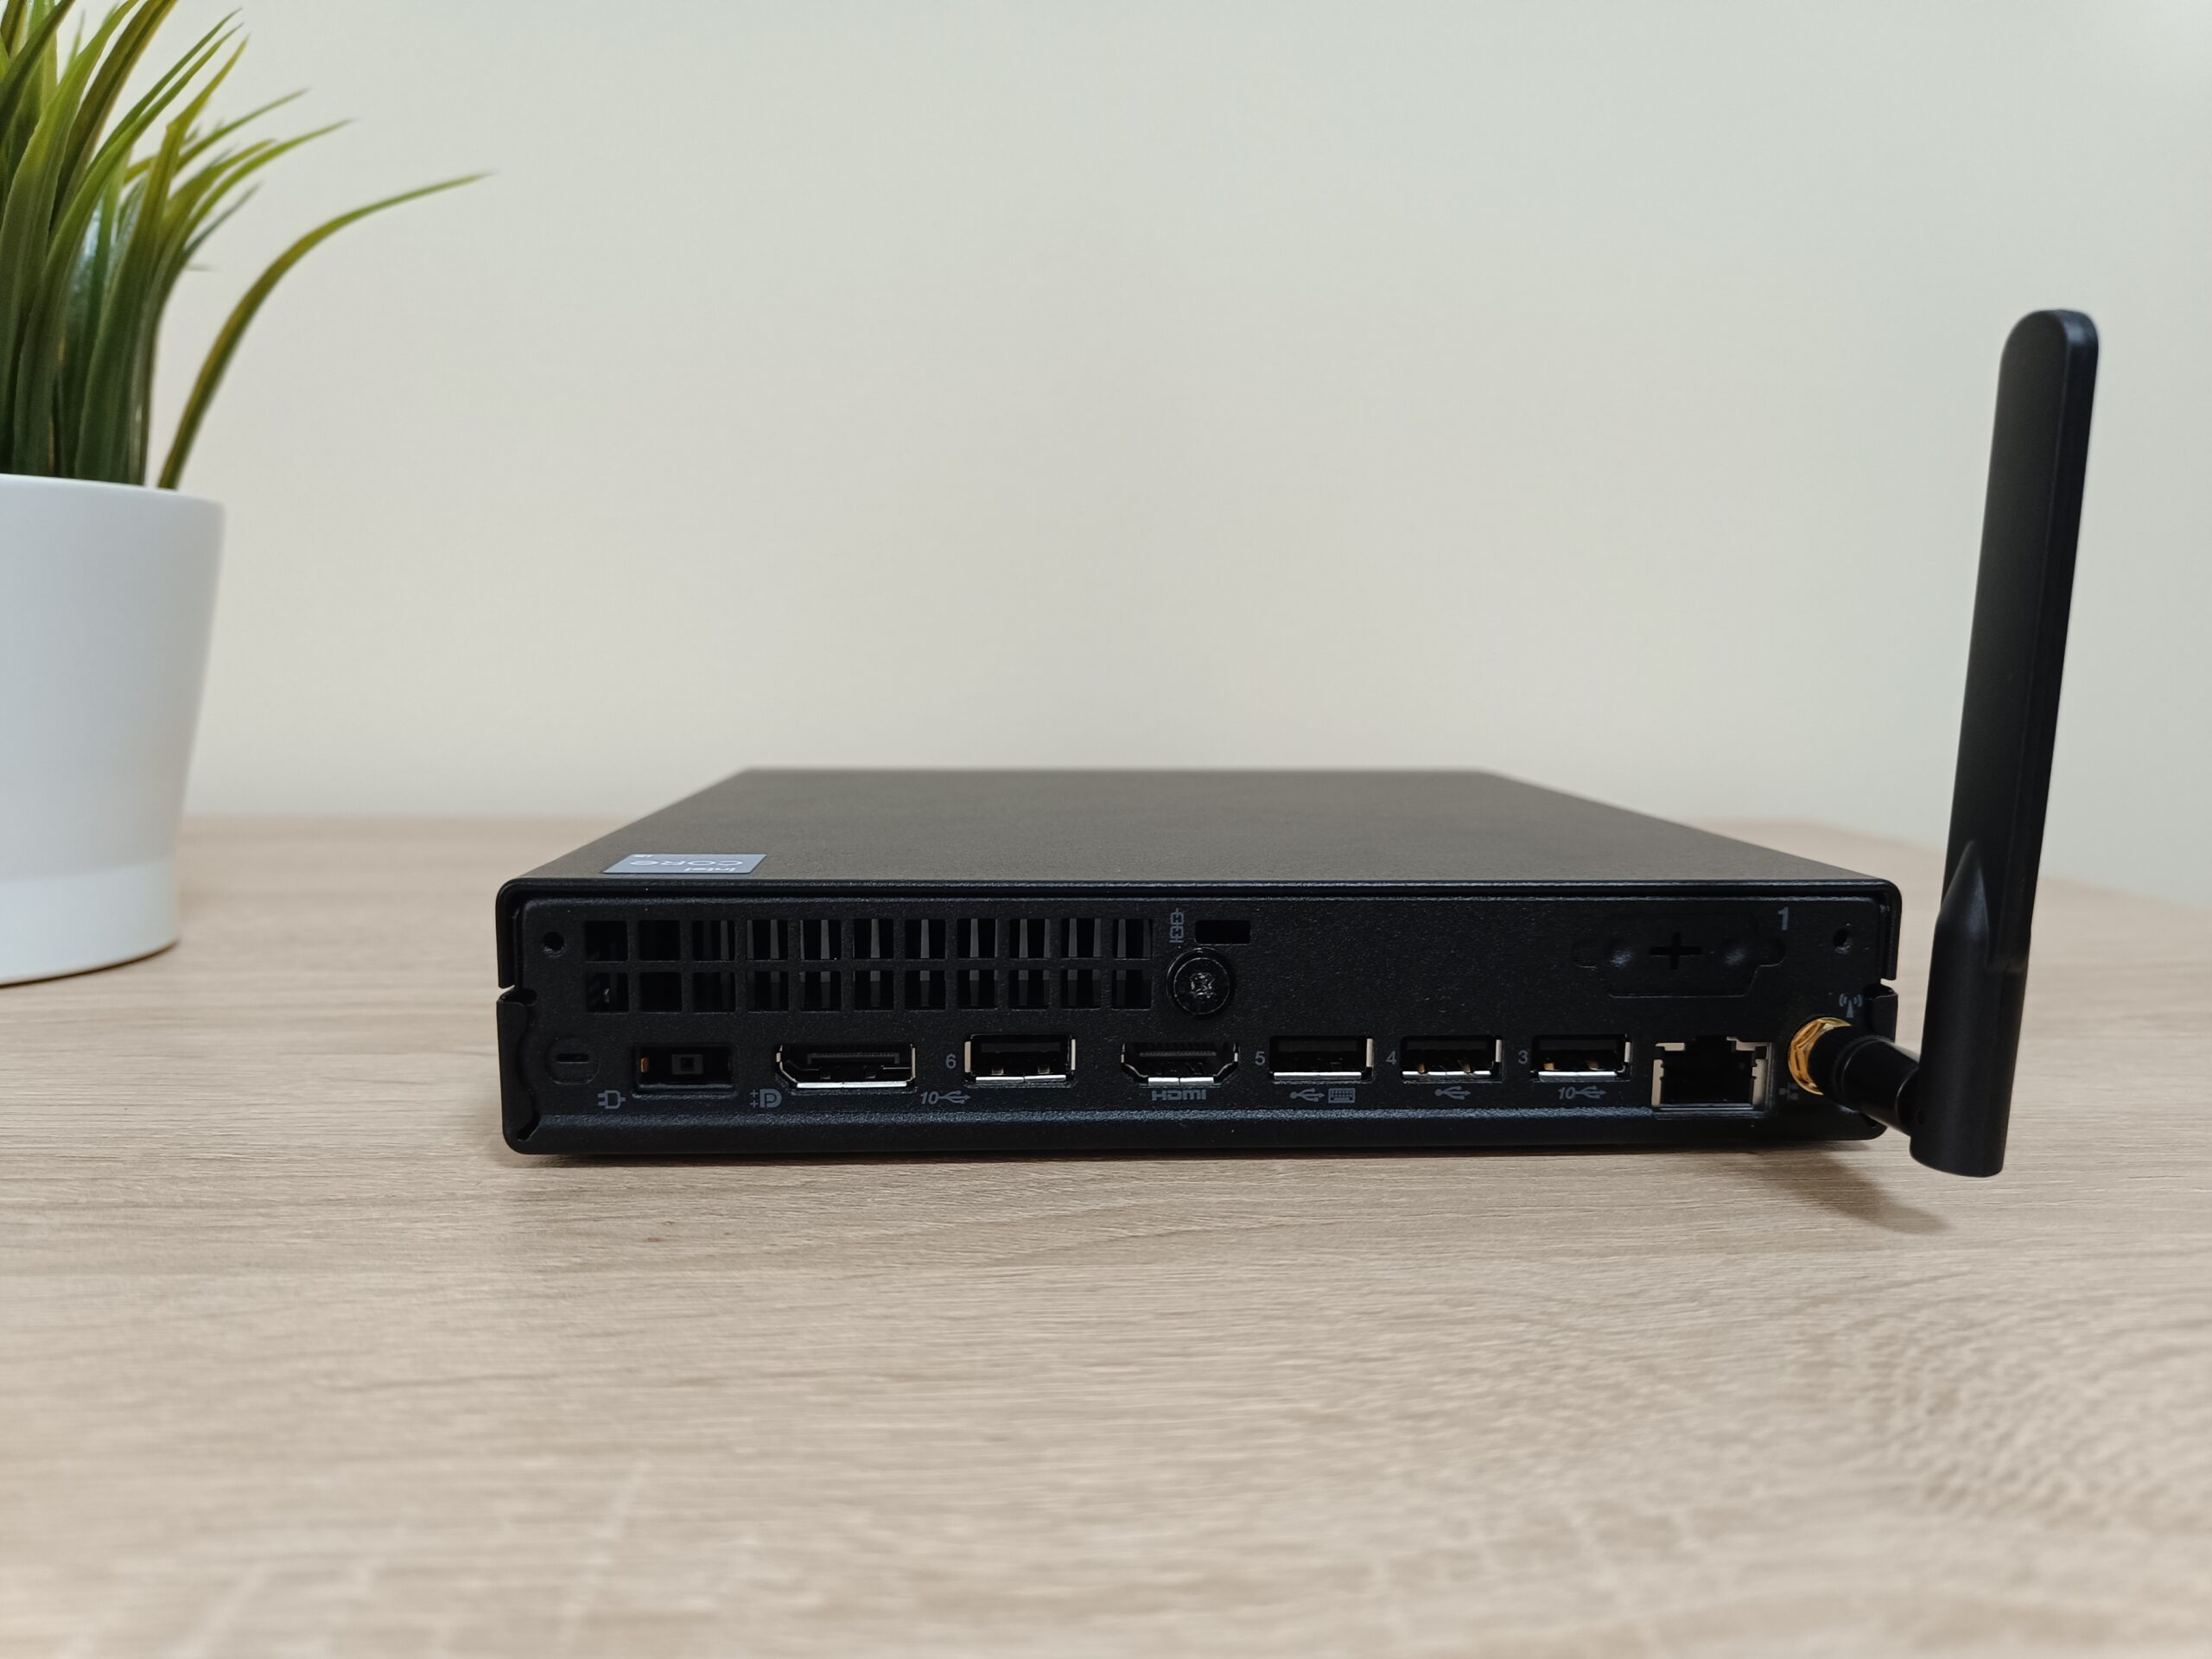
The front panel houses some of the I/O, with an audio jack, one Always On USB Type-A 3.2 Gen. 2 port (with [email protected] charging), and a USB Type-C 3.2 Gen. 2 port (with [email protected] charging). On the back, there are more ports, with two USB Type-A 2.0 ports, two more USB Type-A 3.2 Gen. 2 ports, one HDMI 2.1 TMDS port (aka an HDMI 2.0 port), one DisplayPort 1.4 port, and a RJ-45 port for a hardwired connection. There’s also an optional Punch out port available.
What you do is you can order a port part from Lenovo’s website, then remove the metal plate that hides where exactly on the motherboard you need to screw it in, and voila, you have an extra port of your choosing added to your PC. On the ThinkCentre Neo 50Q Gen 4, you can pick between an extra DisplayPort 1.4, a VGA port, or a serial port.
Performance – CPU, GPU
Test System Configuration
| Lenovo ThinkCentre Neo 50Q Gen 4 | |
| Processor | Intel Core i5-13420H (1.50 – 4.60GHz) |
| Graphics | Intel UHD Graphics Xe G4 (48EU) |
| RAM | 8GB DDR4 3200MHz |
| Storage | 256GB SSD |
We’re kicking things off with a classic – Cinebench R23, which reveals the general performance of the Core i5-13420H. Cinebench offers a Multi-Core and a Single-Core benchmark, each of which simulates a different workflow. The Multi-core benchmark activates all cores and threads and pushes them to the limit, simulating heavy Creator workloads like 3D Rendering or complex video editing.
The Single-core part mimics a lot of gaming, as many games value having strong individual core performance, rather than all of them working super well together. As you can see, the single-core performance of the chip is rather high, especially when compared to a heavy hitter like the Core i9-13980HX, which offers only an 8.6% jump in performance.
Now, the Multi-core score is much more different, as it shows the complete chip under full load. Expectedly, the Core i5 isn’t allowed to stretch its legs that much due to the size and cooling limitations of the chip, as we’ve had previous laptops with it go well into the 12000s in Cinebench.
| Model | Multi-Core | Single-Core |
| Intel Core i5-13420H – Lenovo ThinkCentre Neo 50Q Gen 4 Tiny | 7634 | 1670 |
| Intel Core i5-13420H – Acer Nitro V 15 (ANV15-51) | 12202 | – |
| Intel Core i5-13420H – HP Omen 16 (16-wd0000) | 12665 | – |
| Intel Core i9-13980HX | 33838 | 1814 |
Next, we have the 3DMark TimeSpy test, which tests the gaming capabilities of a system. To no one’s surprise, the integrated graphics inside aren’t the best for gaming.
| Model | Total Score | Graphics Score | CPU Score |
| Lenovo ThinkCentre Neo 50Q Gen 4 Tiny – Intel Core i5-13420H / Intel UHD Graphics Xe G4 (48EU) | 846 | 740 | 4522 |
3DMark CPU Profile
This benchmark tests the processor in different scenarios: The Max Threads, the 16-threads, and the 8-thread scenario check the capability of the CPU in multi-threaded workloads, which is similar to 3D Editing and Video editing software, as well as modern games, which have learned to take advantage of CPUs with more cores and threads. The 4-thread, 2-thread, and 1-thread tests simulate most older games, which still don’t use more than 4 cores.
| 3DMark CPU profile | Score |
| Max Threads | 3981 |
| 16 threads | 3943 |
| 8 threads | 3541 |
| 4 threads | 2878 |
| 2 threads | 1644 |
| 1 thread | 890 |
Procyon benchmarks
Now we have something new and very, very interesting. From the creators of 3DMark, comes Procyon, a new benchmarking tool made specifically to test productivity and Creator apps like Photoshop, Premiere Pro, Lightroom, as well as the Office Suite. It’s all automated and uses the apps themselves, which is important for getting a real-world feel for how a certain system will behave in an app, while the suite of applications that it uses is right up the alley of the expected user base of the ThinkCentre. The benchmark produces two scores, a Windows score, and an MP score, which is used for comparisons with other platforms like the MacOS systems.
Here’s the Office Productivity Benchmark (OP), which includes apps like Word, Excel, PowerPoint, and Outlook. It offers a standardized approach to testing by pretty much doing the same operation every time you click run. Here are some of the operations app by app:
- Word: Loading and saving documents, cutting, copying, pasting, and editing content and images, finding and replacing text, inserting graphs, and comparing documents
- Excel: Features typical spreadsheet tasks like loading and saving, auto-calculation, inserting data, copy and paste, sorting, using a pivot table, exporting to CSV and PDF, and using common formulas
- PowerPoint: Loads a document, adds images, copies images and text, adds and previews animations, merges content from other files, saves the file, and exports to PDF and video.
- Outlook: Creating emails, moving emails, searching for text within an email, saving attachments, making appointments, and backing up folders.
| Office Productivity | OP Score | MP Score |
|---|---|---|
| Total | 5690 | 205 000 |
| Word | 5805 | 240 000 |
| Excel | 6534 | 167 000 |
| PowerPoint | 5460 | 217 000 |
| Outlook | 4505 | – |
Office Productivity Benchmark Comparison: ThinkCentre Neo 50Q Gen 4 vs Laptops
| Computer | CPU | GPU | RAM | Points |
| Lenovo ThinkCentre Neo 50Q Gen 4 | Intel Core i5-13420H | Intel UHD Graphics | 8GB | 5690 |
| HP Victus 16 (s0000) | AMD Ryzen 5 7640HS | RTX 4050 | 16GB | 6154 |
| MSI Thin GF63 12VE | Intel Core i7-12650H | RTX 4050 | 16GB | 6481 |
| MSI Katana 15 B13V | Intel Core i7-13620H | RTX 4060 | 16GB | 6946 |
 Author: Severin Kolakov

![[June 2026] Best-Selling Laptop Brands on Amazon Global – Apple’s Unrivaled Dominance in Units and Revenue](https://laptopmedia.com/wp-content/uploads/2026/07/GLOBAL-Best-Brands-400x225.jpg)
![[June 2026] Amazon Global: Top 10 Best-Selling Laptops – Apple’s New MacBook Neo Storms to #1, Reshaping the Market with Affordability](https://laptopmedia.com/wp-content/uploads/2026/07/Best-Selling-Laptops-GLOBAL-Top-10-400x225.jpg)
![[June 2026] Amazon Global: Top 10 Best-Selling Gaming Laptops – Acer’s Nitro V 16S AI Dominates Sales, While ASUS Leads Overall Revenue](https://laptopmedia.com/wp-content/uploads/2026/07/Best-Selling-Gaming-Laptops-GLOBAL-Top-10-400x225.jpg)
![[June 2026] Global Ranking of Best-Selling Laptop GPUs on Amazon – NVIDIA RTX 5060 is the Top-Selling Dedicated GPU](https://laptopmedia.com/wp-content/uploads/2026/07/Best-Selling-GPUs-GLOBAL-Top-10-400x225.jpg)
![[June 2026] Global Ranking of Best-Selling Laptop CPUs on Amazon – Apple M5 Dominates, AMD Ryzen 7 260 Gets Solid Premium Share](https://laptopmedia.com/wp-content/uploads/2026/07/Best-Selling-CPUs-GLOBAL-Top-10-400x225.jpg)