ASUS TUF Gaming F15 FX507 review – there are too many versions
Performance: CPU, GPU, Gaming Tests
CPU options
The notebook can be found with the Core i5-12500H or the Core i7-12700H.
Results are from the Cinebench R23 CPU test (the higher the score, the better)


GPU options
In terms of graphics, you can choose from the RTX 3050 (95W), RTX 3060 (140W), and RTX 3070 (140W).
The results are from 3DMark Time Spy (Graphics). Higher is better.
Results are from 3DMark Fire Strike (Graphics) benchmark (higher the score, the better)
The results are from 3DMark Wild Life Extreme Unlimited. Higher is better.
Results are from the Unigine Superposition benchmark (higher the score, the better)
Gaming tests

| Metro Exodus | Full HD, Low (Check settings) | Full HD, High (Check settings) | Full HD, Extreme (Check settings) |
|---|---|---|---|
| Average FPS | 112 fps | 49 fps | 15 fps |

| Borderlands 3 | Full HD, Medium (Check settings) | Full HD, High (Check settings) | Full HD, Badass (Check settings) |
|---|---|---|---|
| Average fps | 100 fps | 66 fps | 49 fps |

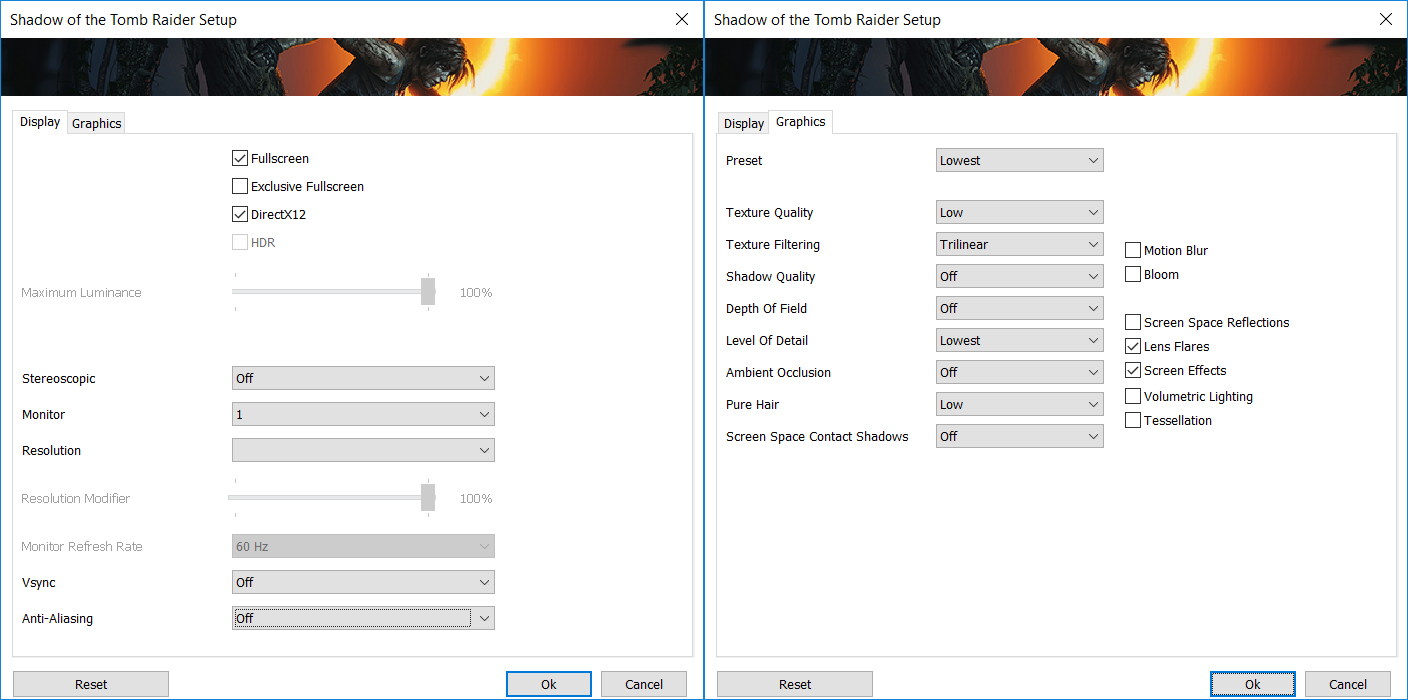
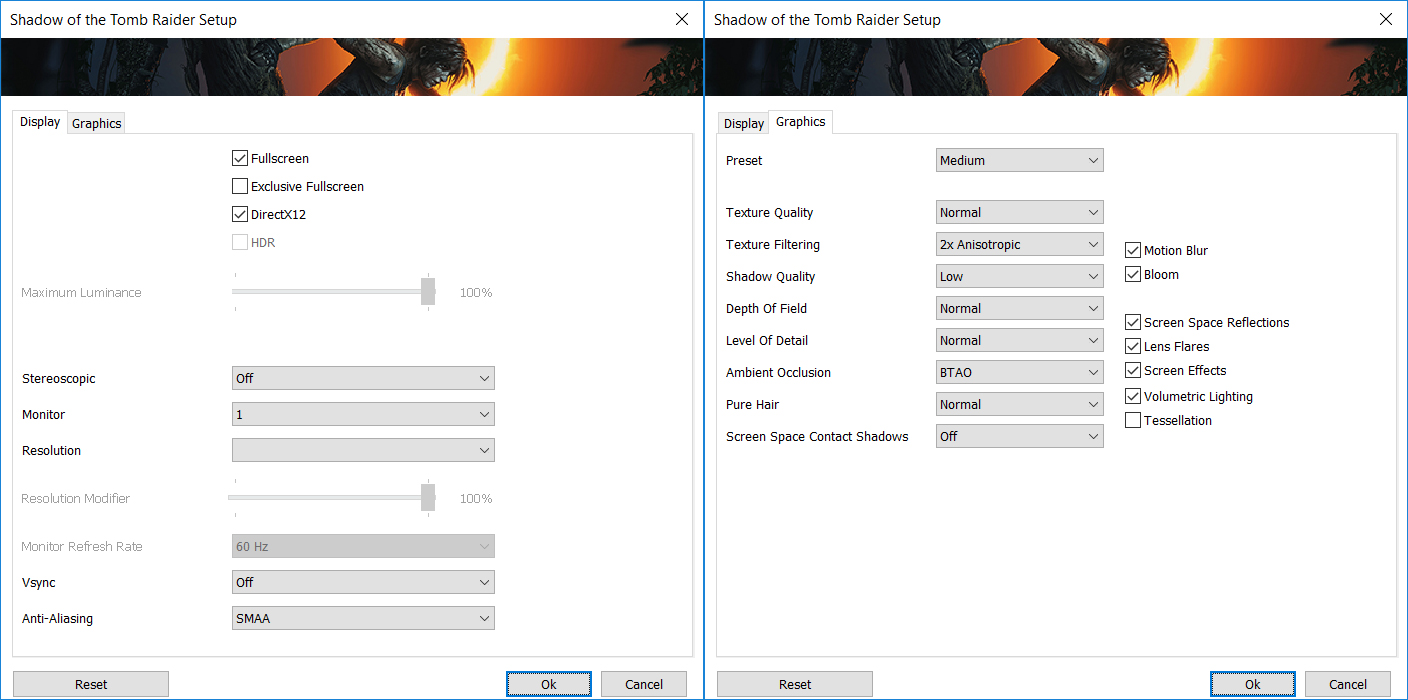
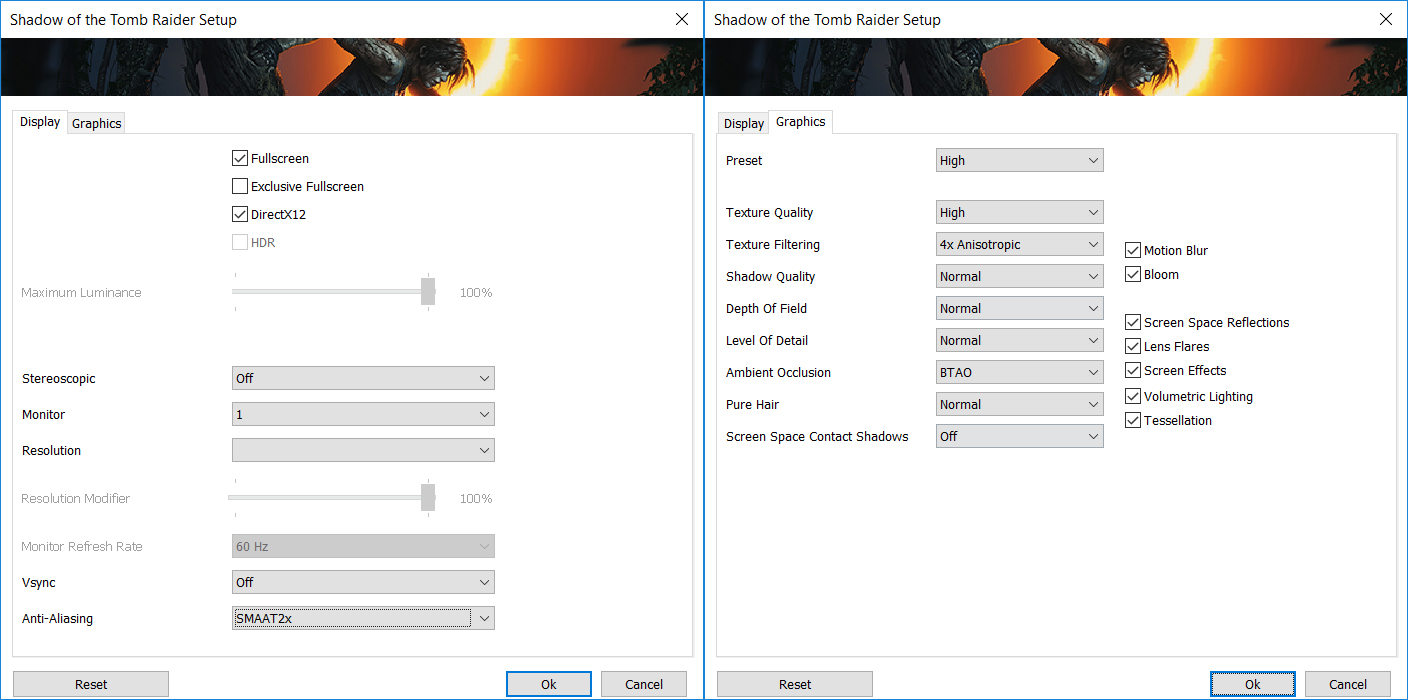
| Shadow of the Tomb Raider (2018) | Full HD, Lowest (Check settings) | Full HD, Medium (Check settings) | Full HD, High (Check settings) |
|---|---|---|---|
| Average | 160 fps | 89 fps | 80 fps |

| Tom Clancy’s Ghost Recon Wildlands | Full HD, Medium (Check settings) | Full HD, High (Check settings) | Full HD, Very High (Check settings) |
|---|---|---|---|
| Average fps | 89 fps | 82 fps | 70 fps |


![[June 2026] Best-Selling Laptop Brands on Amazon Global – Apple’s Unrivaled Dominance in Units and Revenue](https://laptopmedia.com/wp-content/uploads/2026/07/GLOBAL-Best-Brands-400x225.jpg)
![[June 2026] Amazon Global: Top 10 Best-Selling Laptops – Apple’s New MacBook Neo Storms to #1, Reshaping the Market with Affordability](https://laptopmedia.com/wp-content/uploads/2026/07/Best-Selling-Laptops-GLOBAL-Top-10-400x225.jpg)
![[June 2026] Amazon Global: Top 10 Best-Selling Gaming Laptops – Acer’s Nitro V 16S AI Dominates Sales, While ASUS Leads Overall Revenue](https://laptopmedia.com/wp-content/uploads/2026/07/Best-Selling-Gaming-Laptops-GLOBAL-Top-10-400x225.jpg)
![[June 2026] Global Ranking of Best-Selling Laptop GPUs on Amazon – NVIDIA RTX 5060 is the Top-Selling Dedicated GPU](https://laptopmedia.com/wp-content/uploads/2026/07/Best-Selling-GPUs-GLOBAL-Top-10-400x225.jpg)
![[June 2026] Global Ranking of Best-Selling Laptop CPUs on Amazon – Apple M5 Dominates, AMD Ryzen 7 260 Gets Solid Premium Share](https://laptopmedia.com/wp-content/uploads/2026/07/Best-Selling-CPUs-GLOBAL-Top-10-400x225.jpg)

View these reviews, performance very good (not poor in long runs of 15 or 30 minutes)
https://www.tomshardware.com/reviews/asus-tuf-gaming-f15-2022
https://www.laptopmag.com/reviews/asus-tuf-gaming-f15
https://www.notebookcheck.net/Asus-TUF-Gaming-F15-FX507-Series.623521.0.html
Why in the ‘CPU variants’ it shows a score of 13770 for the Intel Core i7-12700H while in the Cinebench R23 CPU test it shows a score of 15062 for the same test.
Is that a mistake in your article?
Thank you.